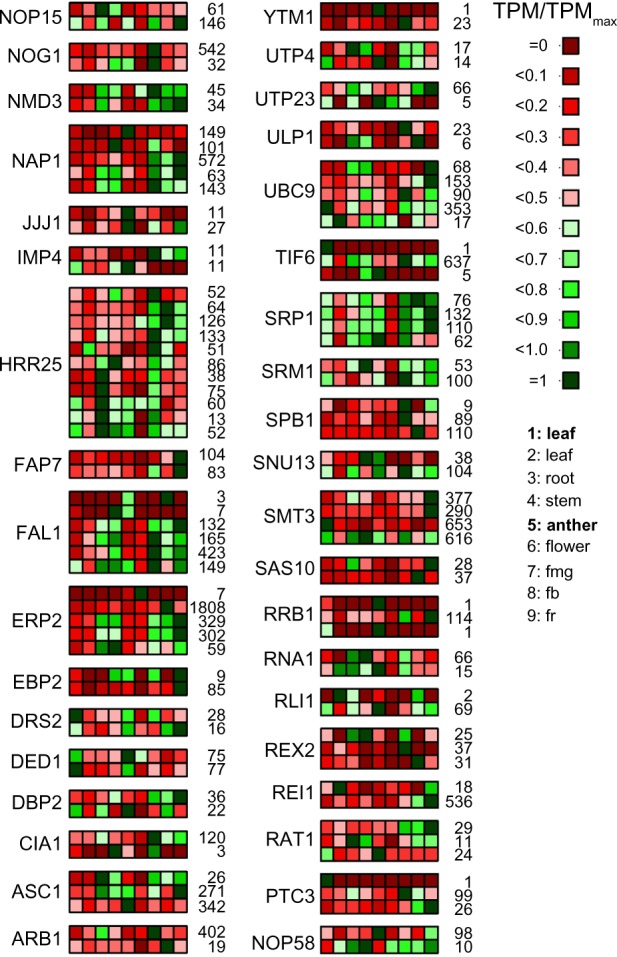
Figure 9.

The expression profile of RBF encoded by multiple genes. The expression values (Supplementary Table 4) for genes coding for RBFs with multiple co-orthologs have been normalized to the individual maximal value given next to the panel and the expression profile is shown (scale on the right). The order of samples is indicated on the right, legend in bold indicates the MACE results; the rest of the samples are derived from the NGS data.33
Abbreviations: fmg: fruit mature green; fb: fruit breaker; fr: fruit ripe.
