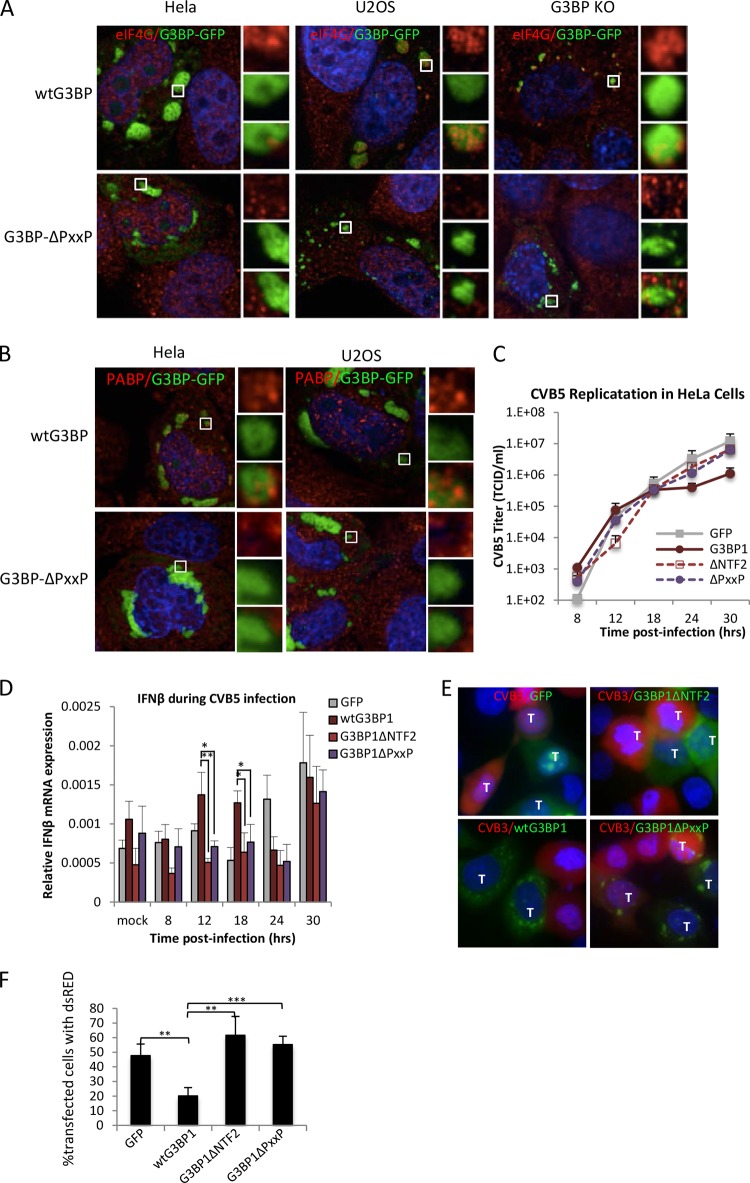
FIG 9.
Enteroviruses replicate in cells with G3BP1ΔPXXP granules. (A) HeLa, U2OS, and G3BP1 KO cells were transfected with wild-type G3BP1-GFP or G3BP1ΔPXXP (green) and counterstained using antibodies against eIF4G (red). (B) HeLa and U2OS cells were transfected with wild-type G3BP1 or G3BP1ΔPXXP (green) and stained with antibodies against PABP (red). The insets represent the boxed areas. (C) HeLa cells were transfected with the indicated transgene and infected 16 h posttransfection with CVB5 at an MOI of 0.1, and the kinetics of virus in the supernatant were measured with TCID50 assays. Transfection efficiency approached 90% in the experiment. (D) At each time point in panel C, HeLa cells were harvested and IFN-β mRNA was measured using qPCR. IFN-β mRNA levels are expressed relative to a β-actin internal-control mRNA. (E) HeLa cells expressing the indicated GFP-tagged transgenes (green; G3BP1ΔNTF2-GFP [G3BP1ΔNTF2] and G3BP1ΔPXXP-GFP [G3BP1ΔPXXP]) were infected at an MOI of 5 for 7.5 h with CVB3-dsRed (red). Cells were harvested and imaged by epifluorescence microscopy. Mock-infected cells showed no red signal and are therefore not shown. Cells expressing transgenes are marked with a T. All other cells were untransfected. (F) Transfected HeLa cells from panel E were quantified as described in Materials and Methods for the presence of red signal indicative of CVB3 infection. The values represent the percentages of transgene-expressing cells that were red. (D and E) The error bars represent standard errors. *, P < 0.05; **, P < 0.01; ***P < 0.001; Student's t test.

