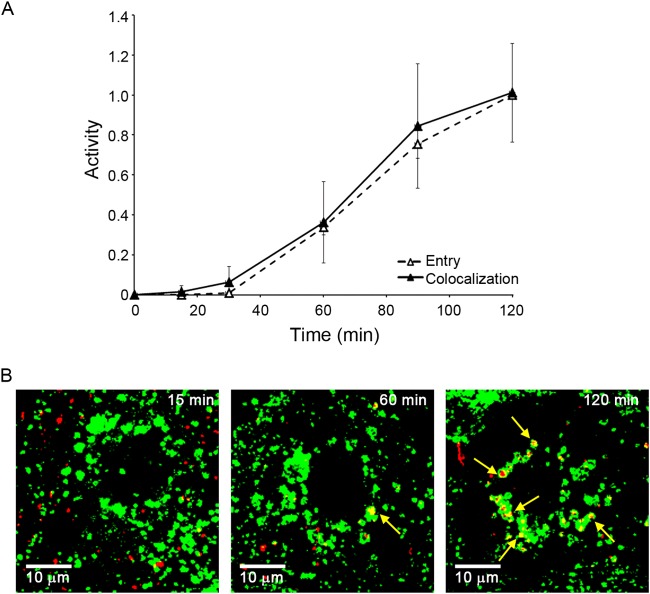
FIG 6.
EBOV VLPs begin to enter the cytoplasm soon after arrival in an NPC1+ endosome. (A) EBOV GP VLPs were bound to parallel sets of BSC-1 cells at 4°C and, after being washed, incubated at 37°C. At the indicated time, cells were analyzed for cytoplasmic entry (open triangles, dashed line) as described for Fig. 1 and for colocalization with NPC1 (solid triangles, solid line) as described in Materials and Methods. Data are the averages from six experiments. In each experiment, entry was monitored in duplicate samples and NPC1 colocalization was analyzed from 20 to 30 microscope fields. Colocalization is presented as Manders coefficients normalized to the average Manders coefficient at the 120-min time point (0.45 ± 0.12). We did not extend the analysis to 180 min, as across all experiments entry at 120 min was 94.5% of that seen at 180 min (i.e., virtually maximal). Error bars indicate SD. There was no statistically significant difference between the extent of colocalization and the extent of entry at any of the time points. (B) Representative micrographs from 15-, 60-, and 120-min time points. Red, VLPs (Cherry-VP40); green, NPC1 (antibody staining). Yellow arrows indicate areas of overlap.

