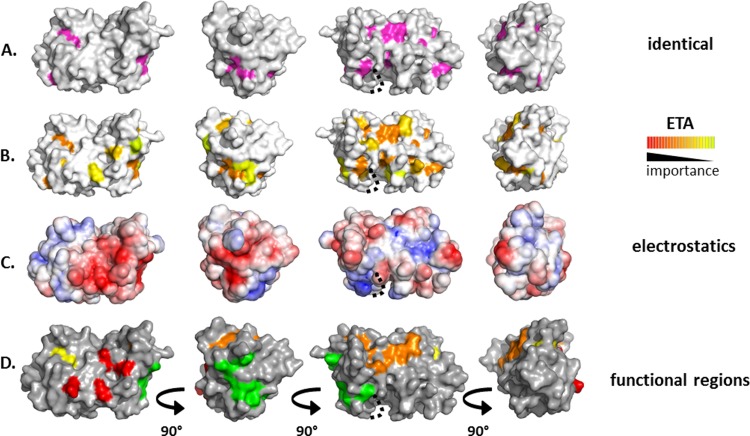
FIG 3.
Analysis of conservation and charge on the surface of UL21N. A dotted line marks a cavity likely obscured by unresolved residues 76 to 87. (A) Completely conserved residues on the surface of UL21N are shown in magenta. Four orientations based on 90° rotations around the vertical axis are shown. (B) Class-specific residues identified by universal evolutionary trace analysis (http://mammoth.bcm.tmc.edu/uet/) are highlighted on the surface of UL21N. The 25% of residues with the highest importance scores are shown. (C) An electrostatic surface potential map of UL21N was generated using the PBEQ Solver function in the Charmm program (http://www.charmm-gui.org/?doc=input/pbeqsolver). (D) Potential functional regions assigned on the surface of UL21N. Potential functional regions are composed of the following residues: region 1 (red), D13, D105, D111, and E113; region 2 (orange), M1, E2, R55, N156, Y163, P165, F170, and L172; region 3 (yellow), Y5, Y17; region 4 (green), Y67, R69, S70, E71, D116, E117, and E121.

