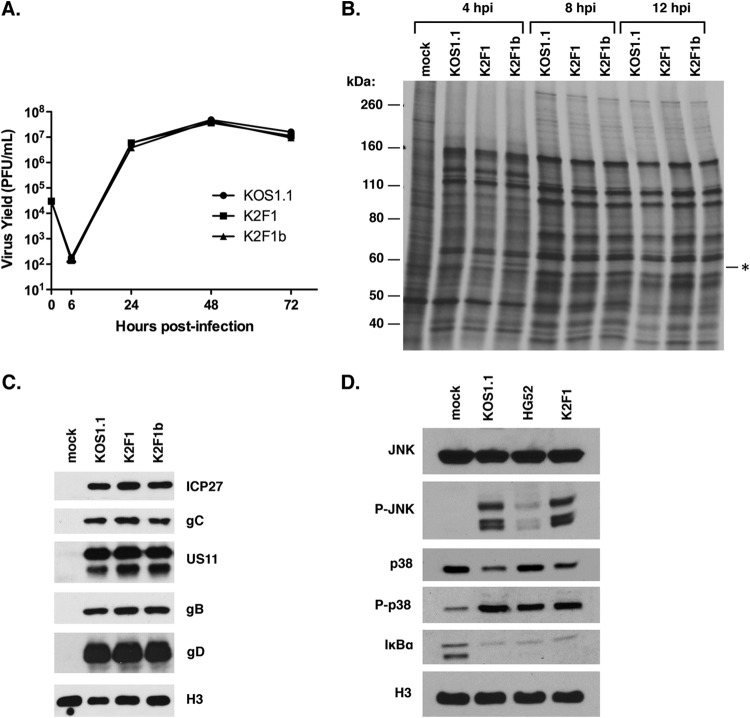
FIG 3.
Phenotypic analysis of K2F1. (A) Growth analysis. Vero cells were infected in triplicate at an MOI of 0.05 PFU/cell as shown, and infections were harvested at various time points. Yields were determined based on titers of the harvested infections by plaque assay on Vero cells. Error bars represent standard errors of the means. (B) Viral protein synthesis. Vero cells were infected at an MOI of 10 PFU/cell as shown, and at various time points the cells were labeled for 30 min with [35S]methionine. The proteins were then analyzed by SDS-PAGE and autoradiography. The asterisk indicates the position of a polypeptide expressed at 4 h p.i. in the K2F1 infections; this protein likely corresponds to ICP27t2. (C) Accumulation of viral proteins. Vero cells were infected as shown at an MOI of 10 PFU/cell. Total proteins were collected at 9 h p.i. and analyzed for viral protein expression by immunoblotting. Histone H3 was analyzed as a loading control. (D) Activation of cellular signaling pathways after HSV-1 infection. Vero cells were infected at an MOI of 10 PFU/cell as shown, and total viral proteins were harvested at 7 h p.i. Activation of cellular signaling pathways was assessed by immunoblotting.

