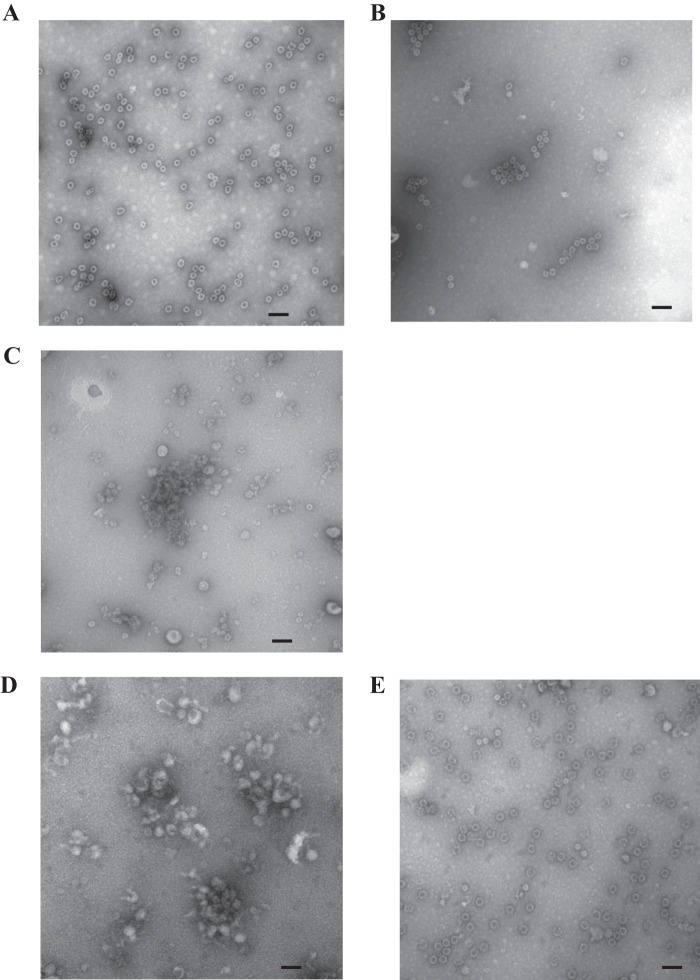
FIG 10.
EM analysis of VLP nanobody complexes. Samples were applied to EM grids and stained with 4% uranyl acetate. (A) GII.10 VLP treated with elution buffer (250 mM imidazole in Tris-HCl-NaCl), (B) GII.10 VLP and Nano-21 mixture, (C) GII.10 VLP and Nano-85 mixture, (D) NSW-2012 GII.4 VLP and Nano-85 mixture, and (E) NSW-2012 GII.4 VLP treated with elution buffer. The scale bar represents ∼100 nm.

