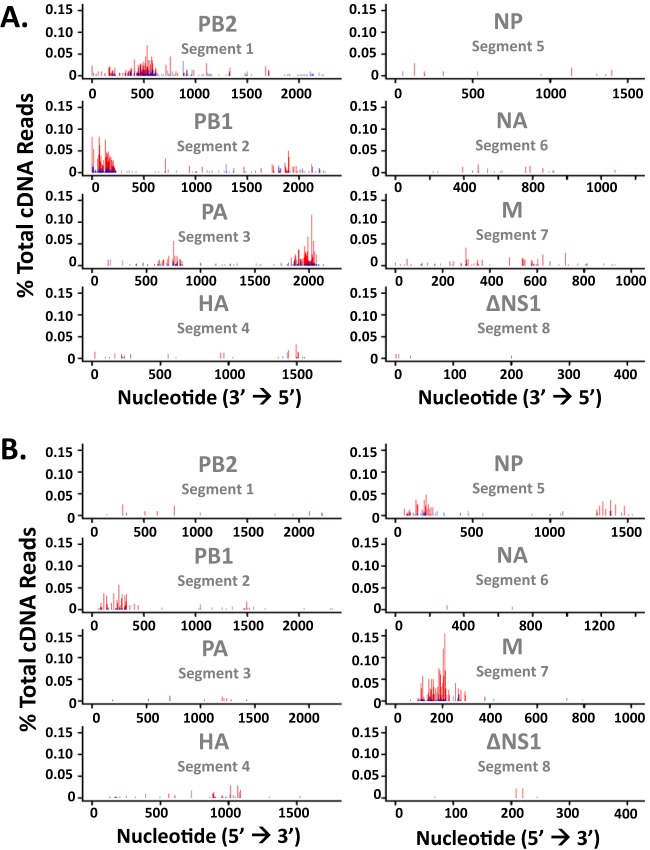
FIG 6.
Frequency and location of cleavage sites in IAV RNAs. Shown are the percentages of the total cDNA reads detected at each nucleotide in IAV RNAs from IAVΔNS1-infected control shRNA-treated cells (red bars) and RNase L shRNA-treated cells (blue bars). (A) IAV negative strands. (B) IAV positive strands.

