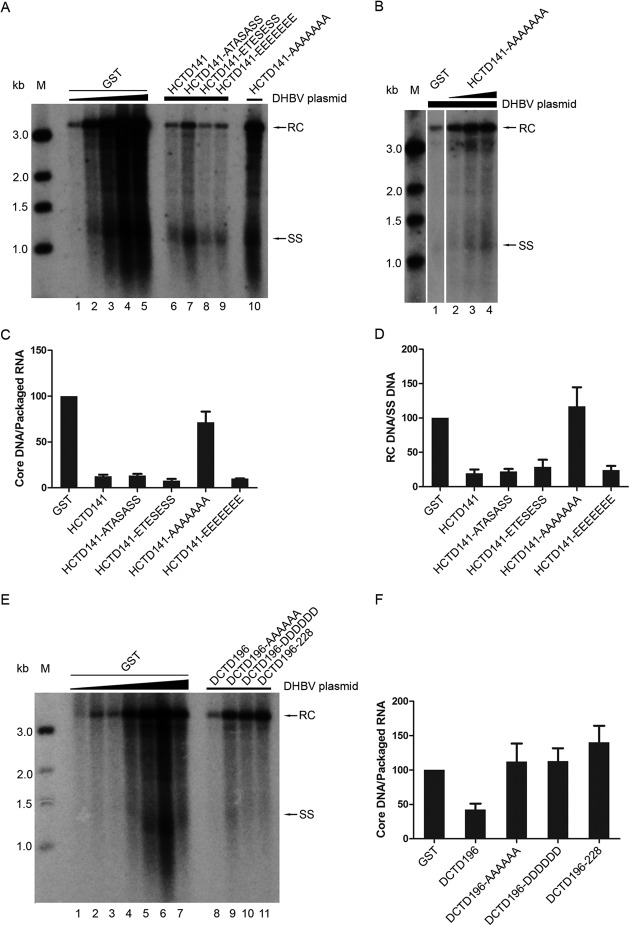
FIG 4.
Effect of HCTD and DCTD on DNA synthesis. (A, B, and E) HEK293 cells were cotransfected as described in the legend to Fig. 3A, B, and E, except that in panel A, the HCTD141-AAAAAAA cotransfection (with strong core DNA signal) was loaded in lane 10 after HCTD141-EEEEEEE in lane 9. Replicative viral DNA intermediates were isolated from cytoplasmic NCs and analyzed by Southern blotting using a radiolabeled DHBV DNA probe. (C and F) The relative levels of total core DNA from the GST-HCTD (A) and GST-DCTD (E) cotransfections were normalized to those of the packaged pgRNA (shown in Fig. 3A and E, respectively), and the core DNA/packaged RNA ratios were compared with that of the control (GST) cotransfection, set to 100 (lane 4 in panel A and lane 2 in panel E). (D) The relative levels of RC DNA from the GST-HCTD cotransfections were normalized to those of SS DNA. The RC DNA/SS DNA ratios were compared to that of the control (GST) cotransfection, set to 100 (lane 4 in panel A). Data are presented as means and SEM from three independent experiments. RC, relaxed circular DNA; SS, full-length single-stranded DNA; M, DNA marker.

