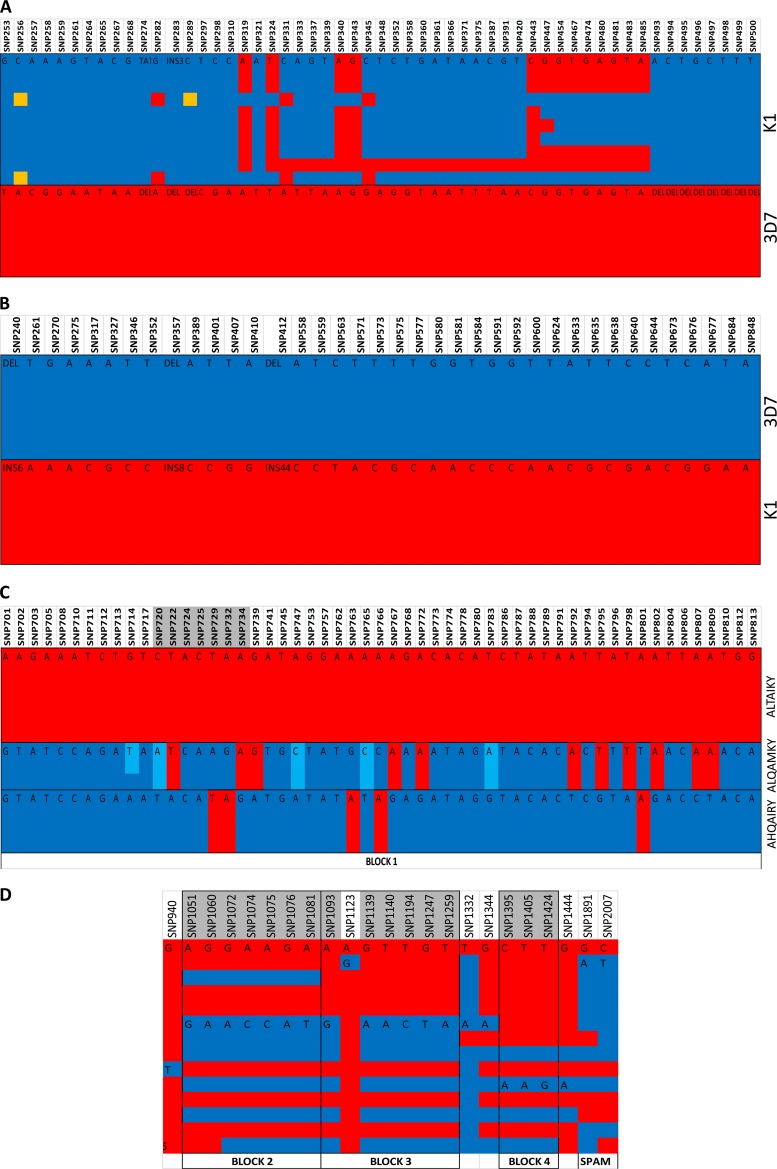
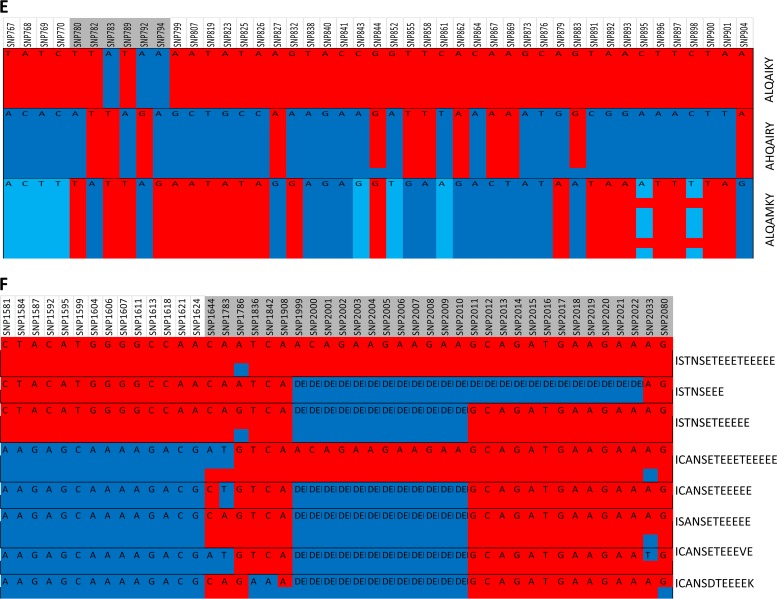
FIG 1.
Linkage disequilibrium in the Pfmsp3 multigene family. The haplotypes were generated from an analysis of sequenced SNPs. Haplotypes shown are Pfmsp3 K1 and 3D7 (A), Pfmsp6 K1 and 3D7 (B), Pfmspdbl1 DBL domain AHQAIRY, ALTAIKY, and ALQAMKY (C), Pfmspdbl1 3′ DBL domain NEVRI, DKIQF, and NEIQF block 2, NGGRI and DEGIK block 3, TSV and TTG block 4, and the SPAM domain KN and EN (D), Pfmspdbl2 DBL domain AHQAIRY, ALQAIKY, and ALQAMKY (E), and Pfmspdbl2 SPAM domain 8 (F). Each column represents an SNP, each color in the column represents a different nucleotide, and each row represents an isolate sequence. The black outline depicts the allelic blocks. The columns shaded in gray are in linkage disequilibrium, and the amino acids from these polymorphisms were used to define the haplotypes. INS, number of nucleotides inserted (e.g., INS3 means 3 nucleotides); DEL, absence of sequence (i.e., a deletion).


