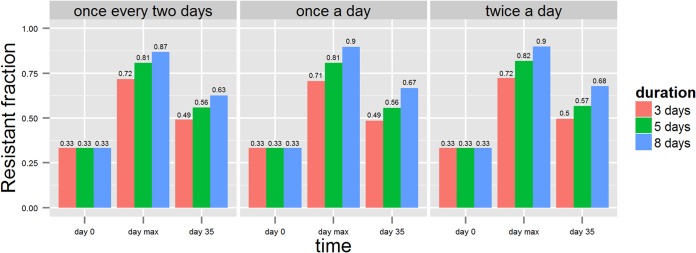
FIG 5.

Fraction of resistant counts at day 0 (before treatment), at “max” (i.e., the maximum fraction after treatment), and at day 35. Different dosing frequencies—low (once every 2 days), normal (once a day), and high (twice a day)—are shown as subplots. Each color bar represents treatment duration.
