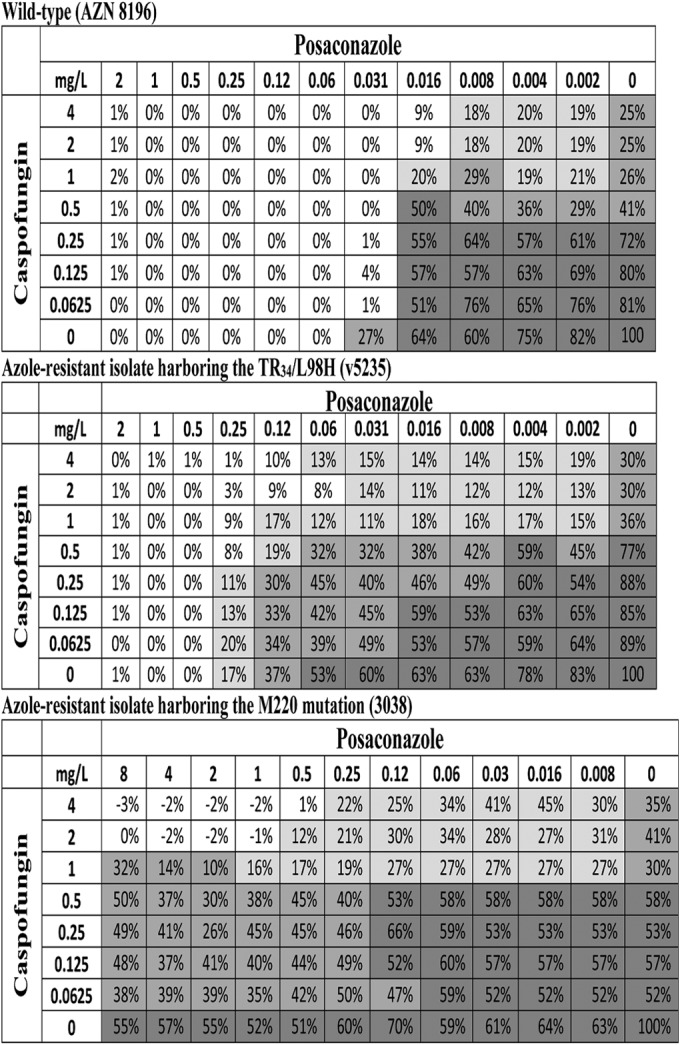
FIG 2.

Checkerboard of the POSA/CAS combination with an azole-susceptible A. fumigatus wild-type isolate (top checkerboard) and two azole-resistant A. fumigatus isolates harboring TR34/L98H (middle checkerboard) and M220 (bottom checkerboard) mutations in cyp51A. Note that the FICi-0min values (0.504, 0.376, and 0.5) were not significantly different, whereas significant differences were found for FICi-2min (1.064, 0.311, and 0.125) for the three isolates, respectively. Numbers inside the checkerboard cells represent percentages of fungal growth assessed with the modified XTT methodology, whereas the intensities of background color represent the three growth endpoints (<10%, white; <25%, light gray; <50%, dark gray).
