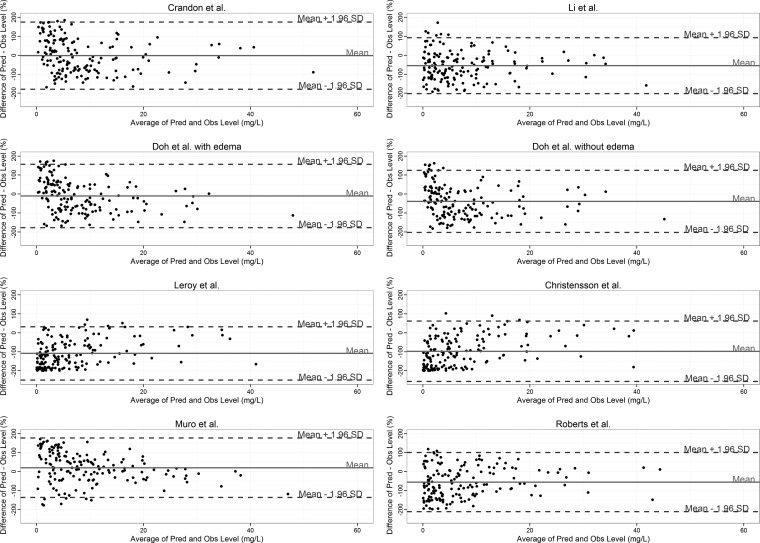
FIG 1.
Bland-Altman plots of relative differences between predicted (Pred) and observed (Obs) unbound meropenem concentrations against the means of predicted and measured unbound concentrations for the models tested. The Li et al. data are from reference 7, and the Roberts et al. data are from reference 10. SD, standard deviation. The biases and 95% limits of agreement are shown as solid and broken horizontal lines, respectively.

