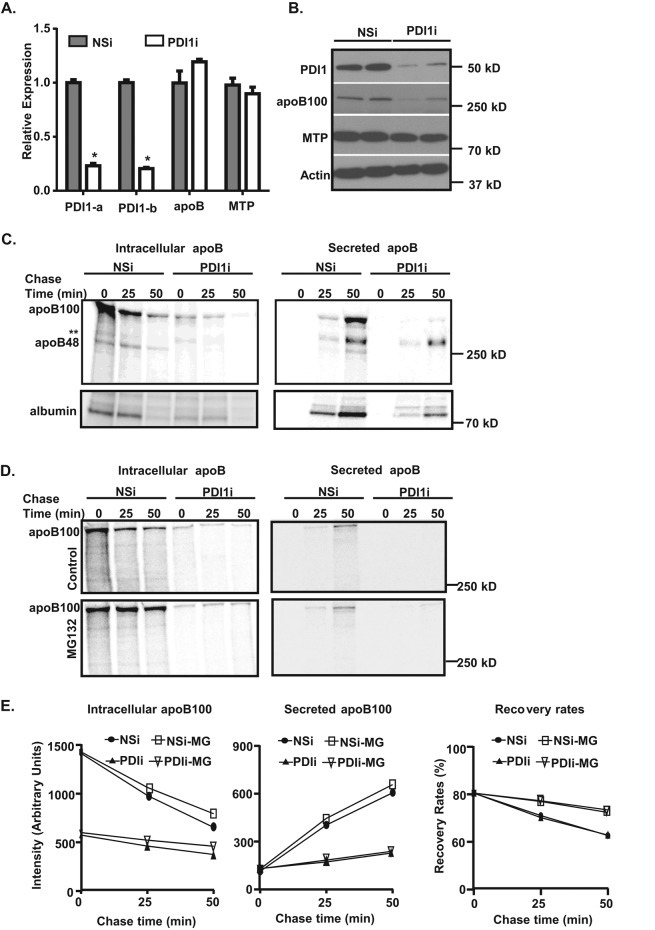
FIGURE 2:
Knockdown of Pdi1 decreases apoB synthesis and secretion in McA cells. (A, B) Pdi1 knockdown in McA cells reduces apoB100 protein but not mRNA levels. (A) Relative abundance of apoB and MTP mRNAs in control (NSi) and Pdi1-knockdown (PDI1i) cells. Relative abundance was normalized to actin mRNA levels. Values are relative to mRNA levels of control cells. *p < 0.01 vs. NSi (B) ApoB100 and MTP protein levels in control (NSi) and Pdi1-knockdown (PDI1i) cells. Cell lysates were immunoblotted for PDI1, apoB100, MTP, and actin. (C) Pdi1-knockdown (PDI1i) in McA cells reduces apoB100 synthesis and secretion. Pulse-chase analysis of intracellular and secreted apoB100 was performed in control (NSi) and Pdi1-knockdown (PDI1i) McA cells. Double asterisks represent a nonspecific band. (D) Proteasomal degradation reduces apoB100 levels in McA cells. Pulse-chase analysis of intracellular apoB100 and secreted apoB was performed in control (NSi) and Pdi1-knockdown (PDI1i) McA cells in the absence (control) or presence of 10 μM MG132. (E) The amount of apoB100 in intracellular and secreted fractions was quantified by ImageJ. Recovery rates of apoB100 are presented as percentage of the sum of apoB100 (intracellular plus secreted) over total apoB100 at zero time point of pulse-chase experiments. Pulse-chase experiments were repeated at least twice.

