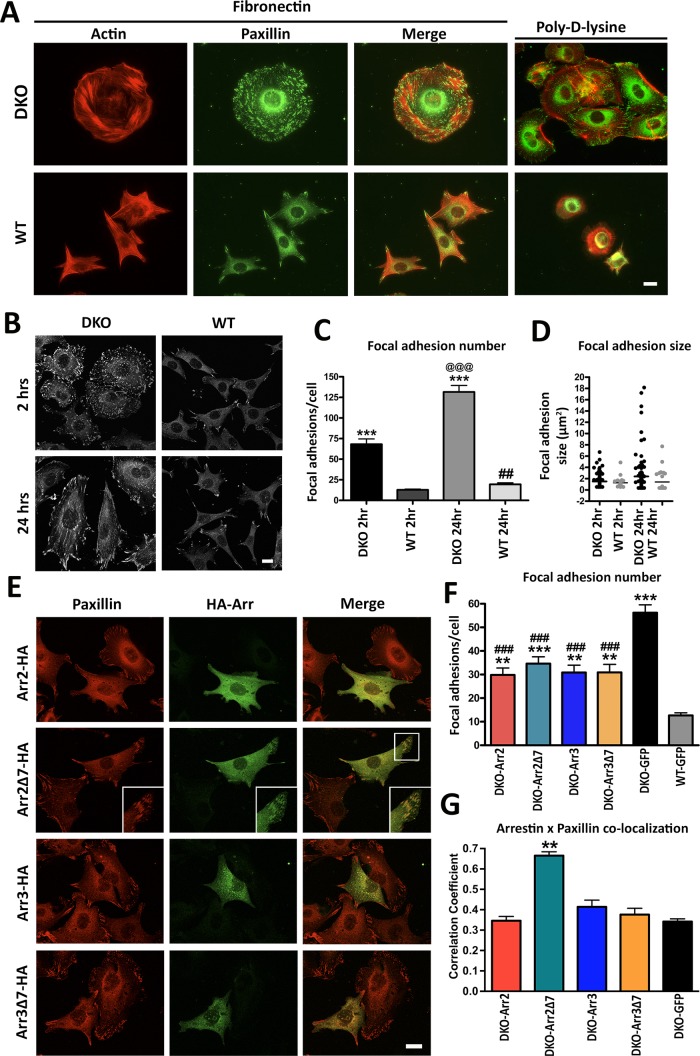
FIGURE 3:
Arrestin knockout increases number and size of focal adhesions. (A) Focal adhesions were detected in DKO and WT cells after 2 h on FN or PDL with anti-paxillin antibody. (B) Cells were plated on FN for 2 or 24 h, and focal adhesions were visualized by paxillin staining. (C) The focal adhesions in DKO and WT cells plated on FN for 2 or 24 h were quantified and analyzed by two-way ANOVA with genotype and time as main factors. ***p < 0.001 compared with WT, @@@p < 0.001 DKO 24 h compared with DKO 2 h, and ##p < 0.01 WT 24 h compared with WT 2h according to Bonferroni/Dunn posthoc test with correction for multiple comparisons. Means ± SD from three experiments (45–67 cells in each). (D) Distribution of focal adhesion size shown by scatter-plot. Focal adhesion size distributions were analyzed by nonparametric Kolmogorov–Smirnov test. Revealed differences: DKO 2 h, p = 0.0023; DKO 24 h, p < 0.0001; WT 24 h, p < 0.0001, as compared with WT 2 h. Data for 600–5000 focal adhesions. (E) Confocal images of DKO and WT cells expressing HA-tagged arrestins and stained for paxillin. Inset, arrestin-2-Δ7 colocalization with paxillin. (F) Focal adhesion number was calculated in arrestin-expressing DKO cells (25–50 cells/condition). Data were analyzed by one-way ANOVA with arrestin type as the main factor. **p < 0.01 DKO-arrestin-2, DKO-arrestin-3, DKO-arrestin-3Δ7 compared with WT; ***p < 0.001 DKO-arrestin-2-Δ7 compared with WT; ###p < 0.001 compared with DKO-GFP according to Bonferroni/Dunn posthoc test with correction for multiple comparisons. Scale bar, 10 μm (A, B, and E). (G) Colocalization of paxillin (red) and arrestins or GFP control (green) was determined using Coloc2 function in ImageJ after background correction in cells expressing HA-arrestins and stained for HA and endogenous paxillin, as described in Materials and Methods.

