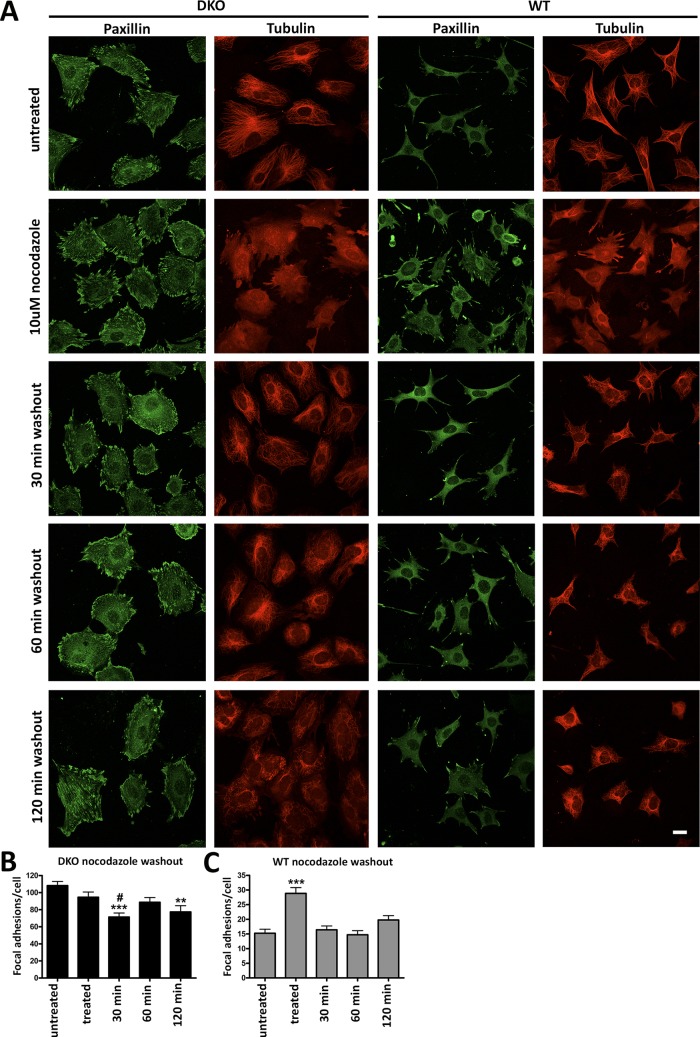
FIGURE 5:
Nocodazole treatment reveals different focal adhesion dynamics in WT and DKO cells. (A) DKO and WT cells were plated for 24 h and treated with or without 10 μM nocodazole for 2 h. Nocodazole was washed out, and microtubules were allowed to regrow for 30, 60, or 120 min. Paxillin and microtubules were visualized with respective antibodies. Scale bar, 10 μm. (B, C) Means ± SD number of FAs in 40–50 cells/condition. Data were analyzed by one-way ANOVA with treatment as the main factor, followed by Bonferroni/Dunn posthoc test with correction for multiple comparisons. (B) DKO cells: ***p < 0.001, 30-min washout compared with untreated cells; #p < 0.05 compared with treated cells; **p < 0.01, 120-min washout compared with untreated cells. (C) WT cells: ***p < 0.001, treated cells compared with all other conditions.

