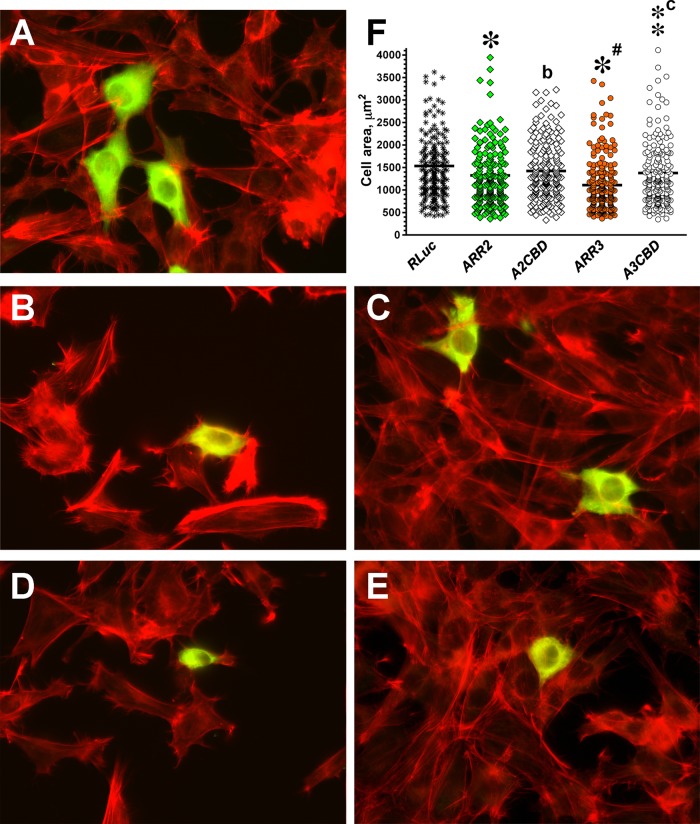
FIGURE 6:
Arrestin interaction with clathrin contributes to arrestin-dependent regulation of cell morphology. (A–E) Representative images of DKO cells expressing HA-tagged arrestin stained with anti-HA antibodies (green) and rhodamine–phalloidin (red). (A) Control DKO MEFs transfected with HA-Rluc. (B) DKO MEFs transfected with WT arrestin-2. (C) DKO MEFs expressing clathrin binding–deficient A2CBD mutant. (D) DKO MEFs expressing WT arrestin-3. (E) DKO MEFS expressing A3CBD mutant. (F) Scatter plot showing the results of cell size analysis. The horizontal bars represent the medians. The cell size data were analyzed by Kruskal–Wallis analysis of variance, followed by posthoc pairwise comparison by Mann–Whitney test with Bonferroni correction for multiple comparisons. Data are from ∼200 cells/condition from four independent experiments. *p < 0.001, **p < 0.01; *p < 0.05, as compared with cells expressing RLuc; ap < 0.05; cp < 0.001, as compared with cells expressing corresponding WT arrestins.

