FIGURE 7:
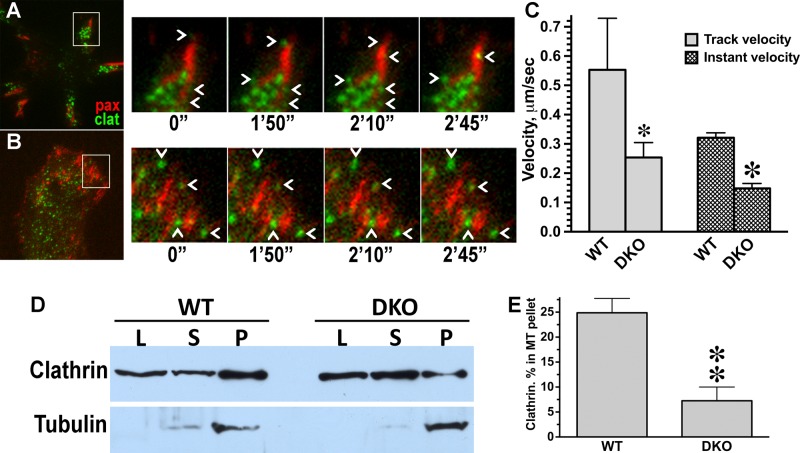
Arrestins are required for normal clathrin dynamics at FA. (A, B) Frames from representative live-cell TIRF imaging sequences of MEFs coexpressing FA marker GFP-paxillin and mCherry-clathrin. (A) WT MEFs. (B) DKO MEFs. Cell overviews are shown on the left. Boxed regions from overviews are enlarged on the right over the time period of 2 min, 45 s. Chevrons indicate clathrin pits, which appear and disappear in WT but are stationary in DKO cell. (C) Velocity of clathrin pit movement at FA is significantly higher in WT than in DKO cells. *p < 0.05 for the track velocity, ★p < 0.001 for instant velocity, according to unpaired Student's t test. (D) DKO and WT MEFs were fractionated as described in Materials and Methods. Aliquots of lysate (L), supernatant (S), and microtubule pellet (P) were analyzed by Western blot using clathrin (top blot) and tubulin (bottom blot) antibodies. (E) The distribution of clathrin between supernatant and microtubule pellet was calculated for two experiments. **p < 0.01, unpaired Student's t test.

