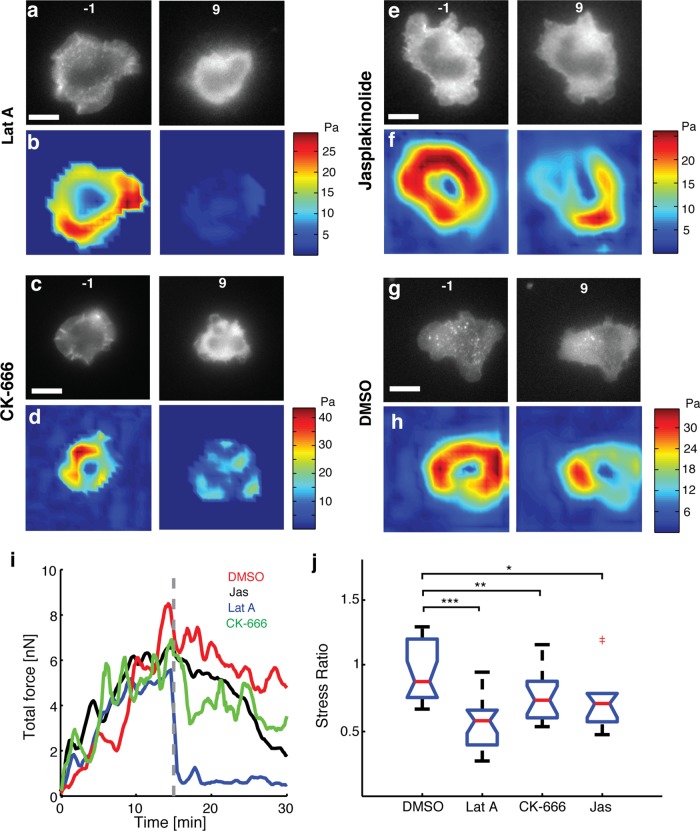
FIGURE 2:
Loss of F-actin dynamics reduces cellular force generation. Fluorescence images of EGFP-actin expressing Jurkat T-cells on an elastic substrate 1 min before (left) and 9 min after (right) application of (a) 1 μM latrunculin-A, (c) 100 μM CK666, (e) 1 μM jasplakinolide, and (g) 0.1% DMSO. Color maps of traction stresses of the same cells before (left) and after (right) addition of (b) 1 μM latrunculin-A, (d) 100 μM CK666, (f) 1 μM jasplakinolide, and (h) 0.1% DMSO. (i) Total traction force as a function of time for a representative cell in each of the conditions described. The dashed line represents the time point at which the drug was added. (j) Comparison of the after-to-before ratios of traction stresses for application of Lat-A (N = 20 cells), CK666 (N = 17 cells), and Jasp (N = 10 cells) with control (DMSO carrier, N = 20 cells). The average stresses in a 3-min time interval just before addition of drug and in the time interval 9–12 min after addition of drugs were used to compute the ratios. *p < 0.05, **p < 0.01, ***p < 0.001.

