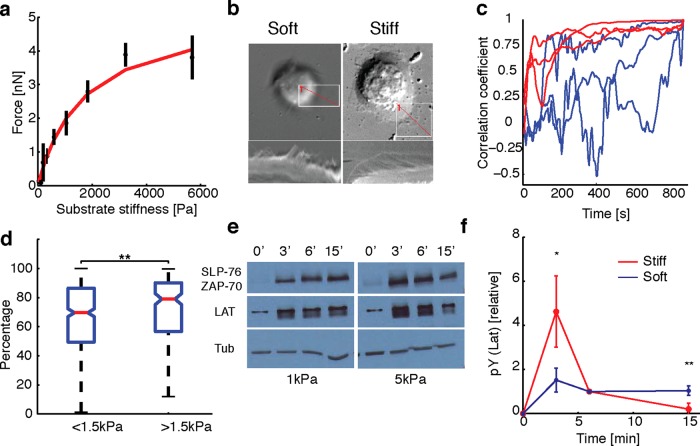
FIGURE 4:
Substrate stiffness affects traction forces and signaling. (a) Average total force exerted by cells (between 14 and 15 min of spreading initiation) as a function of gel stiffness (N = 500). The data are fit to  (red curve) with Fsat = 5 nN, and kcell = 1 nN/μm (corresponding to 1.5 kPa). (b) Top, DIC images of two representative cells spreading on soft (200 Pa) and stiff (10 kPa) gels. Kymographs of edge dynamics for the two cells along the locations indicated by the red lines. (c) Example time traces of Pearson coefficient between cell edge's radial position profile at 15 min and at earlier time points for cells spreading on soft (blue) and stiff (red) gels. (d) Comparison of the percentage of time for which the cell edge profile had correlation coefficient >0.5 compared with the profile at 15 min for softer (<1.5 kPa stiffness) and stiffer (>1.5 kPa stiffness) gels. The difference between the two conditions is significant (t test, p < 0.001) and indicates that cell edges are more dynamic on softer gels. (e) Western blot analysis of tyrosine phosphorylation (pY) levels (of LAT and ZAP70/SLAP76 substrates) at the indicated times on two different gel stiffnesses (∼1 and ∼5 kPa). (f) Densitometry analysis of relative pY levels (for LAT substrate) as a function of time for cells on soft gels (blue curve, ∼1 kPa) and stiff gels (red curve, ∼ 5 kPa). Analysis represents average of five different experiments.

