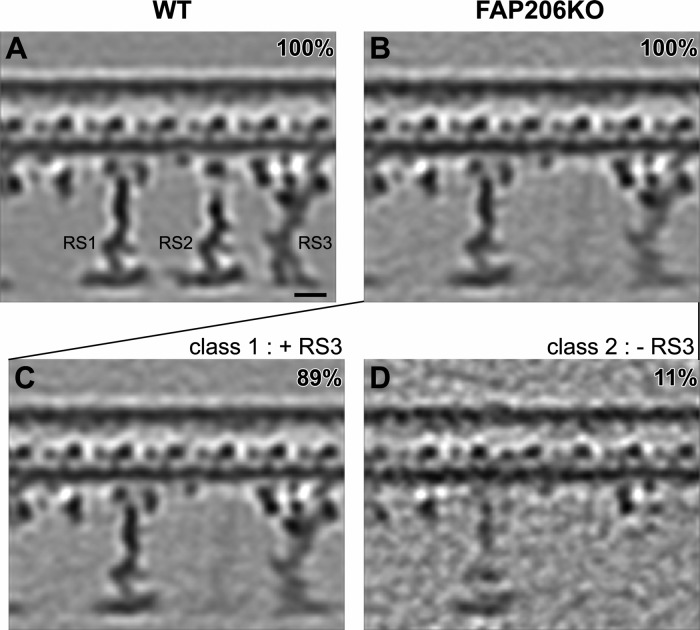
FIGURE 4:
Classification analysis of RS3 reveals that in the absence of FAP206, RS3 is destabilized. Longitudinal tomographic slices (A–D) of averaged 96-nm axonemal repeats show the presence (A–C) and absence (D) of RS3 in WT (A) and FAP206-KO (B–D). The density of RS3 is weaker in the average of all axonemal repeats from FAP206-KO (B) as compared with WT (A). Classification of RS3 resulted in two distinct class averages for FAP206-KO: in the majority (89%) of axonemal repeats from FAP206-KO, RS3 was assembled, whereas a small set (11%) of repeats lacked RS3 (D). All axonemal repeats from WT showed a normal RS3 (A). Scale bar, 10 nm.

