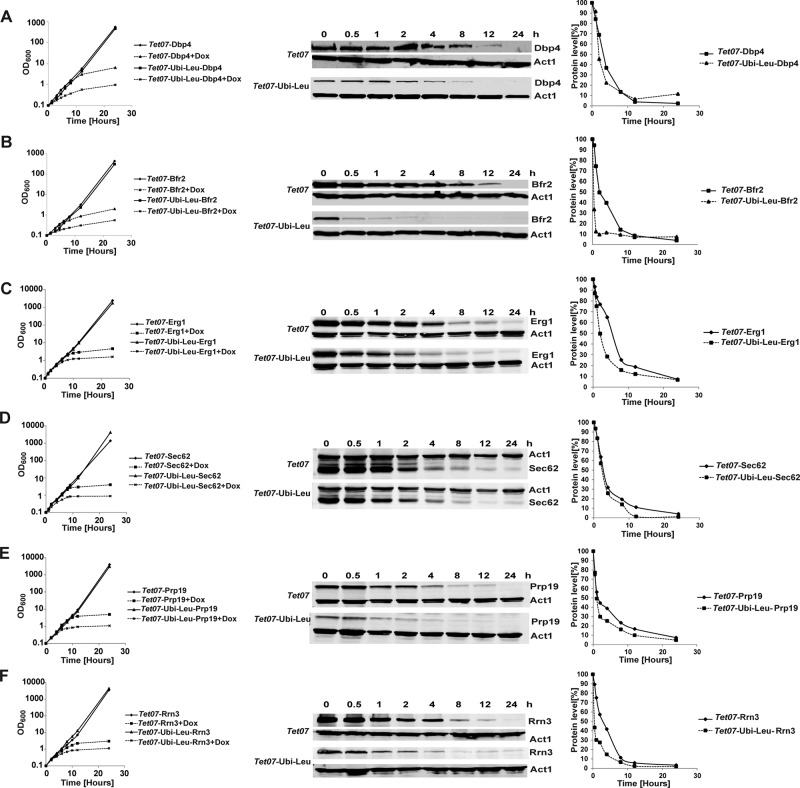
FIGURE 4:
Comparison of depletion of various proteins in TetO7 and Tet07-Ubi-Leu strains. Growth curves (left) and Western blot analysis (middle and right) of strains depleted of essential proteins Dbp4p (A), Bfr2p (B) Erg1 (C), Sec62 (D), Prp19 (E), and Rrn3 (F) using different depletion cassettes. Samples were collected at the indicated time points following the addition of doxycycline. The individual proteins were visualized using antibodies against the HA tag and actin. The quantification of the blots, normalized to actin levels, is shown on the right; a mean of two independent experiments is shown. For growth curves (left charts), the mean of three independent experiments is plotted; vertical y-axes are in logarithmic scale.

