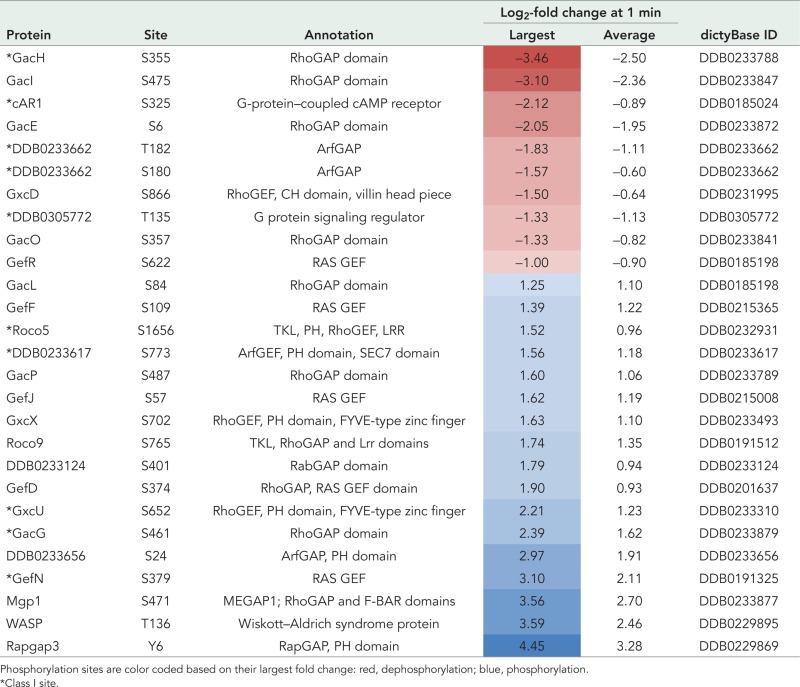
TABLE 1:
Class II phosphorylation sites enriched for GO term GTPase regulator activity (GO:0030695) at 1 min after DIF-1 treatment.
 |
Phosphorylation sites are color coded based on their largest fold change: red, dephosphorylation; blue, phosphorylation.
*Class I site.
