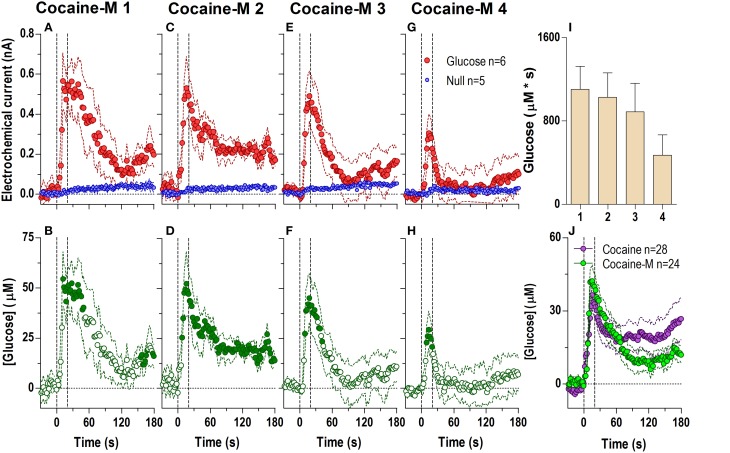
Figure 3.
Relative changes in NAc [glucose] induced by cocaine-methiodide injections assessed at high temporal resolution (2-s bins). Top graphs (A,C,E,G) show mean ± SEM changes in relative currents (nA) detected by Glucose and Null sensors. Bottom graphs (B,D,F,H) show mean ± SEM changes in [glucose] (μM) as a difference between Glucose and Null sensors. Two vertical hatched lines (at 0 and 20) marked the onset and offset of the injection. Horizontal dotted lines show basal levels (= 0 nA and μM). The difference in current dynamics between active and null sensors was significant (p < 0.05) for the entire 180-s duration after each cocaine injection (A 1: Glucose/Null [F(1, 9) = 6.69], interaction [F(91, 819) = 3.60]; C 2: Glucose/Null [F(1, 9) = 26.6], interaction [F(91, 819) = 2.23]; E 3: Glucose/Null [F(1, 9) = 1.85], interaction [F(91, 819) = 4.03]; G 4: interaction [F(91, 819) = 2.33], all p < 0.05]. Concentration change was also significant for each cocaine injection for the entire analysis window [F(5, 445) = 4.28, 2.74, 5.01, and 2.95, all p < 0.05]. Individual values significantly different from baseline (Fisher test) are shown as filled symbols. Right panel (I) shows mean ± SEM v glucose responses assessed by area under the curve (n.s.). Right panel (J) compares the mean glucose response between the cocaine and cocaine-methiodide group; no significant differences found.

