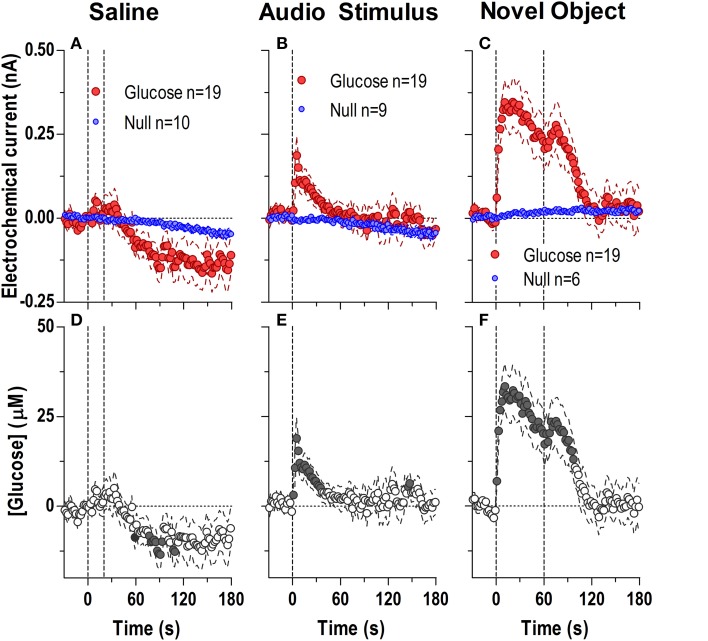
Figure 7.
Rapid changes in NAc [glucose] induced by saline injection (A,D) and exposure to a brief auditory stimulus (B,E) and a novel object (C,F). Top graphs show changes in Glucose and Null currents and bottom graphs show resulting changes in glucose concentration. Saline injections resulted in a significant difference in current dynamics (p < 0.05) for the entire analysis window [180 s; Interaction: F(90, 2430) = 1.94 p < 0.05] indicating a significant decrease in glucose after the injection [F(18, 1620) = 3.773 p < 0.05]. Concentration values significantly different from baseline (Fisher test) are shown as filled symbols. A brief audio stimulus and a novel object induced rapid and dynamic differences in Glucose and Null currents [Audio Stimulus, 129 s; Interaction F(65, 1690) = 1.95; Novel object, 180 s; Interaction F(90, 2070) = 4.34, both p < 0.05], revealing highly phasic glucose changes over the entire analysis window [Audio Stimulus, F(18, 1620) = 2.41; Novel object, F(18, 1620) = 14.85, both p < 0.05].

