Figure 5.
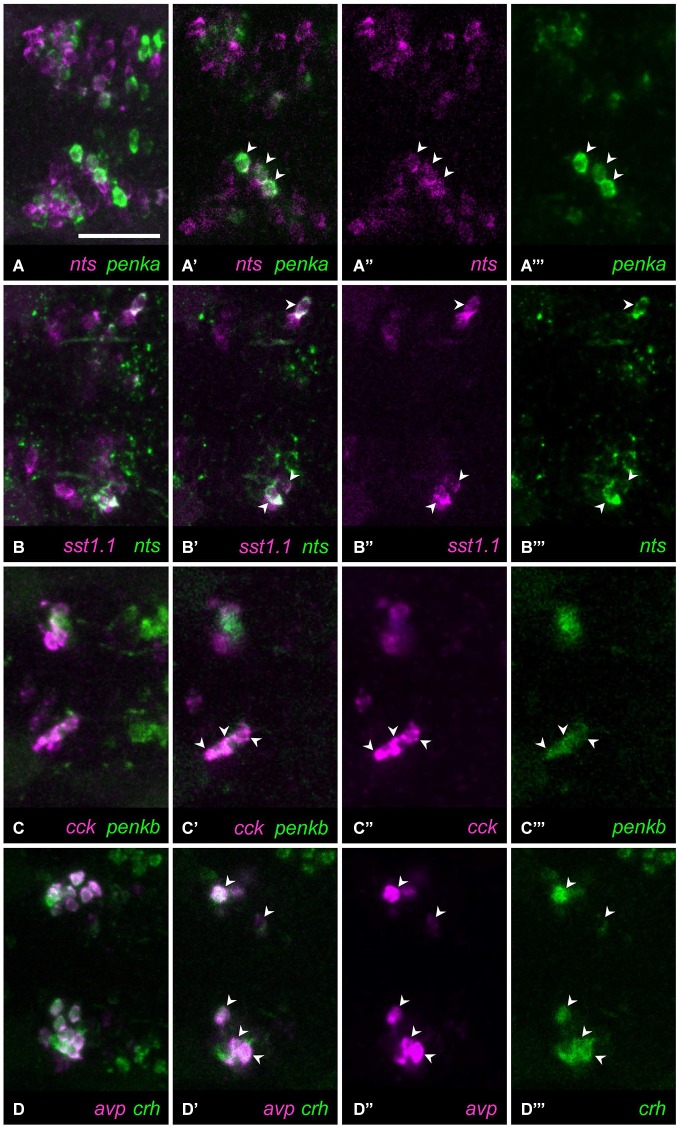
Four combinations of neuropeptides show higher coexpression. (A) In most animals, several cells show coexpression ((A) maximum intensity projection; (A’) single plane) of nts (A”) with penka (A”’). (B) In all animals, few cells show coexpression ((B) maximum intensity projection; (B’) single plane) of sst1.1 (B”) and nts (B”’). (C) High coexpression can be found ((C) maximum intensity projection; (C’) single plane) in the rostral clusters of cells expressing cck (C”) or penkb (C”’). (D) Consistently high coexpression ((D) maximum intensity projection; (D’) single plane) can be observed for the intermingled avp-positive (D”) and crh-positive clusters (D”’). Arrowheads mark coexpressing cells. Scale bar: 50 μm.

