
Figure 6.
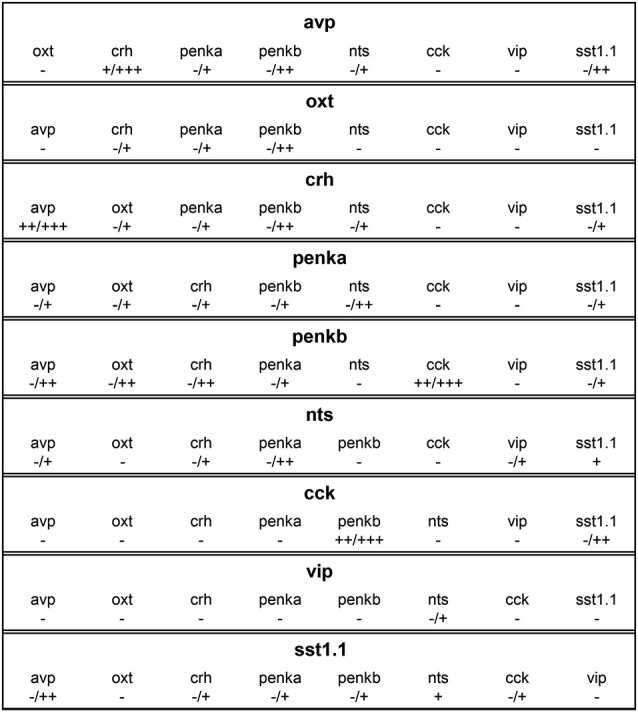
Overview of coexpression profiles of cells expressing avp, oxt, crh, penka, penkb, nts, cck, vip, or sst1.1. Coexpression degrees indicate complete absence (−), rare occurrence (+), low coexpression (++), or high coexpression (+++). In many combinations, coexpression was variable, and the minimum and maximum degrees are indicated (min/max). Differences between the coexpression of one peptide in one cell type and vice versa are caused by differences in cell cluster sizes.