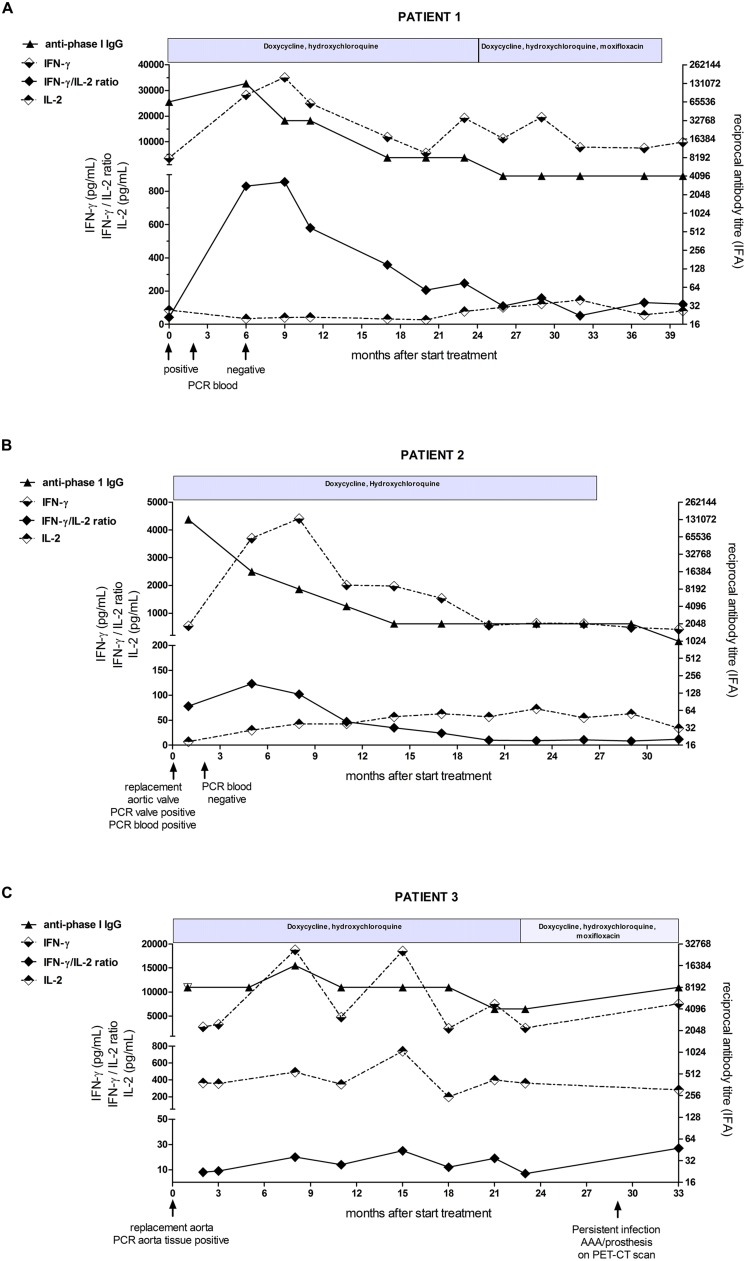
FIGURE 1.
Detailed overview of immunological parameters in (A) patient 1 (B) patient 2, and (C) patient 3 from start of antibiotic treatment to end of study follow-up. The IFN-γ and IL-2 concentrations (dotted lines) and the IFN-γ/IL-2 ratio (black diamant) are shown on the left y-axis, the anti-phase I IgG antibody-titer (black triangle) is shown on the right y-axis. The course of antibiotic treatment is depicted above each graph.

