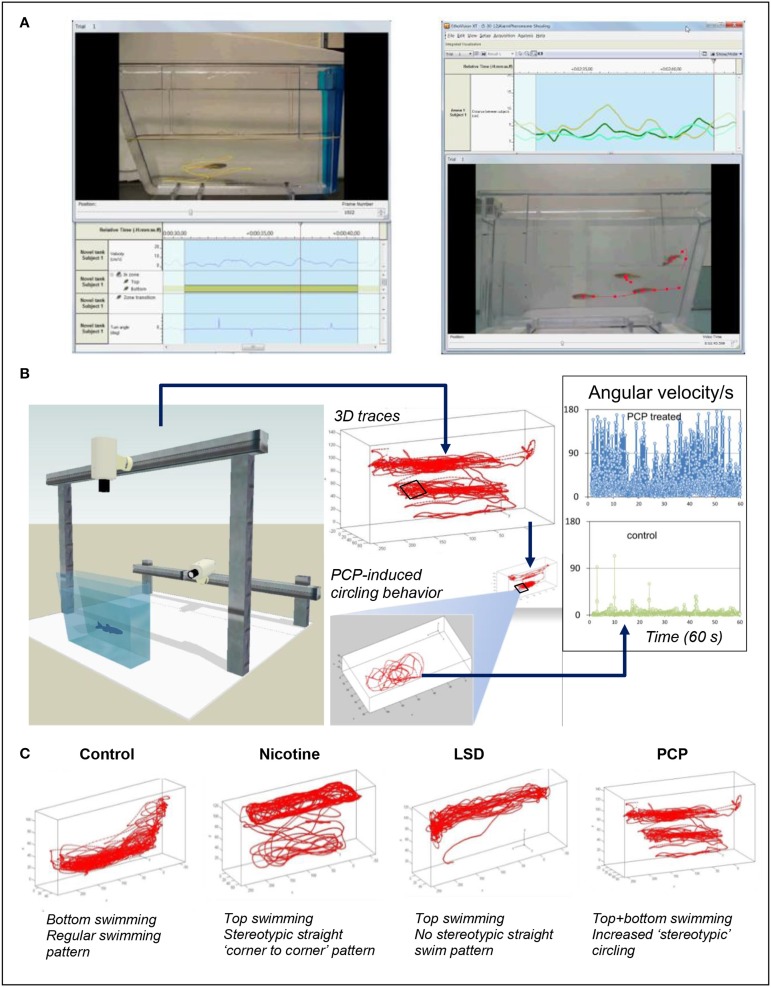
Figure 1.
The use of video-tracking tools to assess neural phenotypes in zebrafish. (A) Shows video-tracking of an individual zebrafish (left) or a zebrafish group (shoal, right); side view vide-recording in the novel tank test. Tracking individual fish with one camera in 2D, or with two cameras in 3D, can generate up to 50–60 individual endpoints (see Supplementary Table 1S online for examples) which can be sensitive to neuroactive properties of the drugs. Tracing selected endpoints in zebrafish shoals, such as assessing the average inter-fish distance and velocity, is also possible in zebrafish models (Green et al., 2012) (although more sophisticated computer tools and optimized animal tagging methods are needed to monitor each individual fish within the group). (B) Illustrates the potential of 3D behavioral video-tracking in zebrafish to predict drug pharmacology (also see Soleymani et al., 2014). In this example, top swimming combined with elevated angular velocity in zebrafish treated with a hallucinogenic drug phencyclidine (PCP, inset) shows a striking difference from control fish, supporting the value of various computer-based neural phenotypes for predicting the pharmacological profile of different CNS-active compounds. (C) Shows examples of representative 3D phenotypes for control fish and animals acutely exposed to several CNS drugs. LSD, Lysergic acid diethylamide (images: courtesy of Noldus IT, Netherlands, in collaboration with the Kalueff Laboratory, Stewart et al., 2014a). Note distinct patterns of locomotion evoked by drugs from different pharmacological classes (also see Cachat et al., 2011, 2013; Soleymani et al., 2014 for discussion).

