Figure 7.
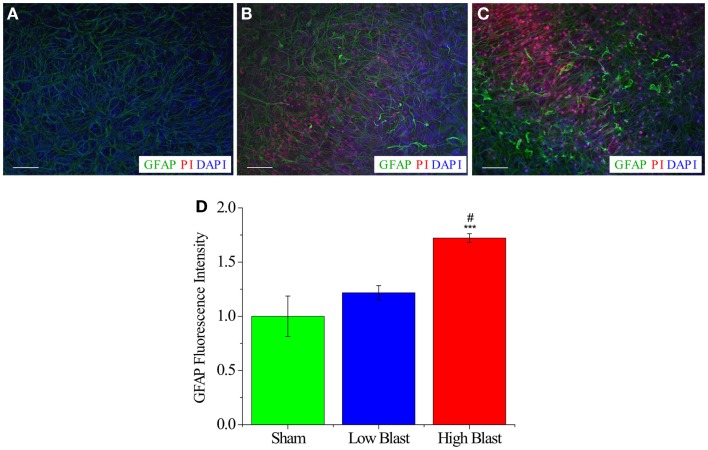
Astrocyte activation in blast-exposed OHCs. Representative images of CA1 region from sham-injured (A), low-blast (B), and high-blast OHCs (C) that were fixed at 72 h following blast exposure and stained with anti-GFAP (green), PI (red), and the nuclear counter stain (DAPI). (A) OHCs maintained low level of astrocyte activation and PI staining at 72 h following sham injury. Activated astrocytes, as visualized by increased GFAP expression, hypertrophy, and thicker processes, were observed both in low- (B) and high-blast (C) groups at 72 h following blast exposure. (D) Quantification of GFAP staining demonstrated significant increase in GFAP MPI in OHCs exposed to high-blast compared to sham-injured OHCs (***P < 0.001) and OHCs exposed to the low blast (#P < 0.05). Scale bars 50 μm.

