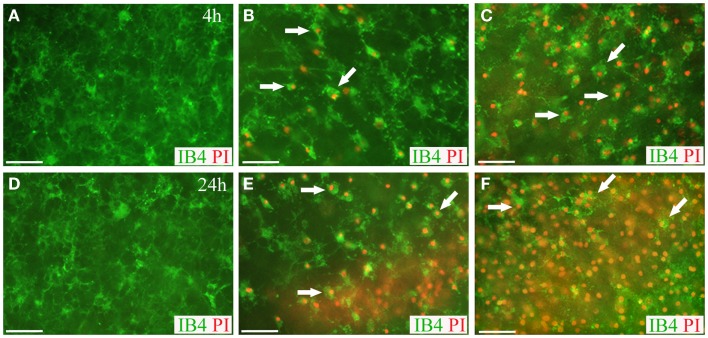
Figure 8.
Live microglia imaging in OHCs following blast exposure. Microglial cells in OHCs were labeled with IB4 (green) and images of CA1 region were captured at 4 h (A–C) and 24 h (D–F) following sham (A,D) or blast injury (B,C,E,F). OHCs maintained low level of microglial activation and PI staining (red) at 4 h (A) and 24 h (D) following sham injury. Dead microglial cells that were co-labeled with IB4 and PI (arrows) were observed in low- (B) and high- (C) blast group at 4 h post-injury. Even more prominent microglial death was detected in low- (E) and high- (F) blasted OHCs at 24 h post-injury. Activation-induced change in microglia morphology from ramified to rounded was also observed in blasted OHCs (B,C,E,F). Scale bars 50 μm.

