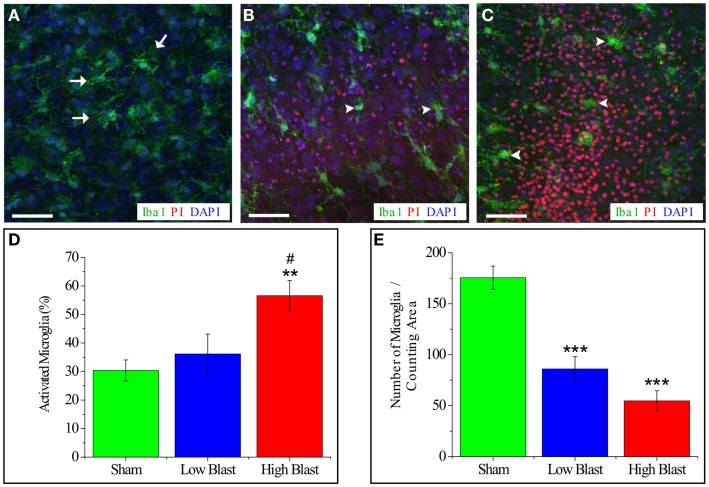
Figure 9.
Quantification of activated microglia and total microglia number per counting area in blast-exposed OHCs. OHCs were fixed at 72 h post-injury and stained with Iba1 (green), PI (red), and DAPI counter stain (blue). Representative confocal images of CA1 region of sham-injured (A) and blasted OHCs (B,C). Sham-injured sections (A) showed ramified, resting microglia (arrows). Low-blast (B) and high-blast (C) OHCs demonstrate increased number of activated, rounded, amoeboid microglia (arrowheads). Scale bars (A–C) 50 μm. (D) Quantification of activated microglia within ROI in CA1 area revealed significantly higher percentage of activated microglia in high-blast OHCs compared to sham controls (**P < 0.01) and compared to low-blast sections (#P < 0.05). (E) Quantification of total number of microglial cells per counting area in CA1 region demonstrated significant decrease in OHCs exposed to low (***P < 0.001) and high blast (***P < 0.001) compared to the sham-injured OHCs. n = 5–9 sections per each experimental group.

