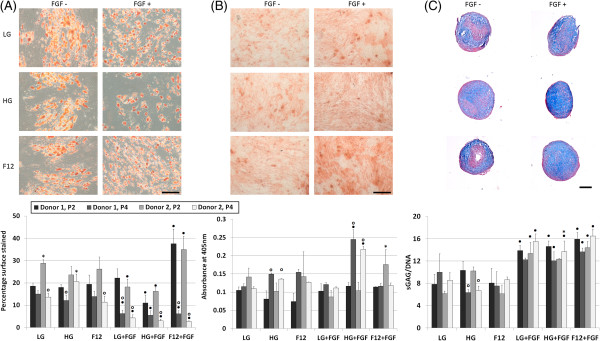
Figure 3.

P2 and P4 ASCs cultured from two different donors in chemically defined differentiation media after 21 days. (A) Adipogenic assay stained using oil red O and quantified by measuring the percentage of surface area stained; (B) osteogenic assay stained using alizarin red and quantified by measuring the light absorbance at 405 nm; (C) chondrogenic pellet assay stained using alcian blue and nuclear fast red and quantified using biochemical assays for DNA and GAG. n = 3, ● represents a significant difference between FGF and the equivalent non-FGF-supplemented media; o represents a significant difference between P2 and P4 cells; *significant difference between donors, p < 0.05; scalebar = 20 μm for A and B and 100 μm for C, representative images display the results from P2 donor 1.
