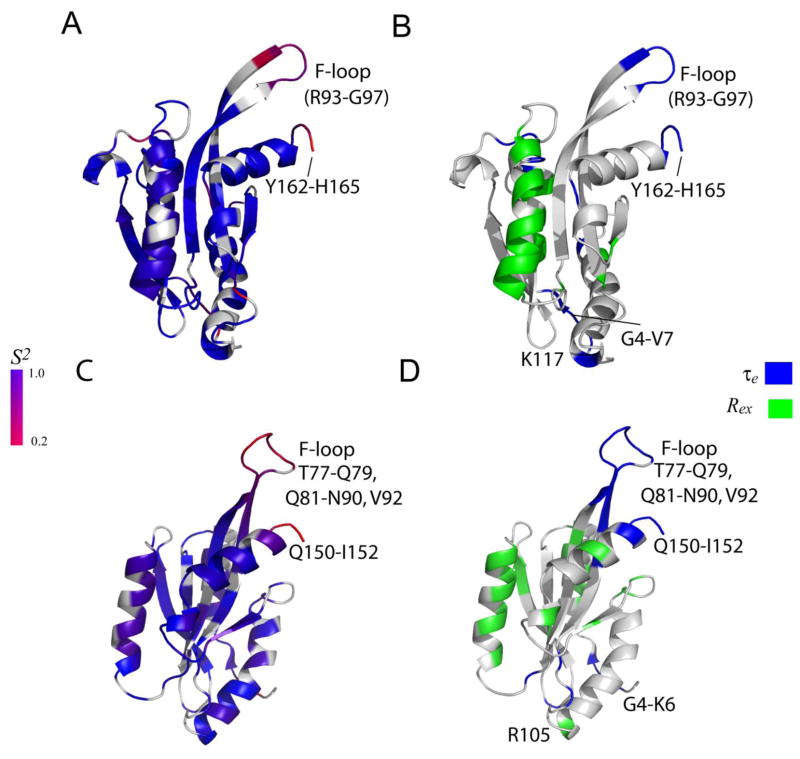
Figure 8. Ribbon diagram representing the dynamics properties of UNC-60A and UNC-60B.
(A) & (C) The ribbon representations of UNC-60A and UNC-60B solution structures shaded according to the S2 values derived from Modelfree analysis, respectively. The color coding is from blue for S2=1, to red for S2=0.2. Prolines and residues that are not included in Modelfree analysis are colored gray. (B) & (D) The ribbon representations of UNC-60A and UNC-60B shaded according to chemical exchange (Rex) terms, effective correlation (τe) times from Modelfree analysis, respectively. The residues displaying motion on picosecond to nanosecond timescale (τe) are represented in blue, residues displaying conformational exchange (Rex) from Modelfree analysis are represented in green.

