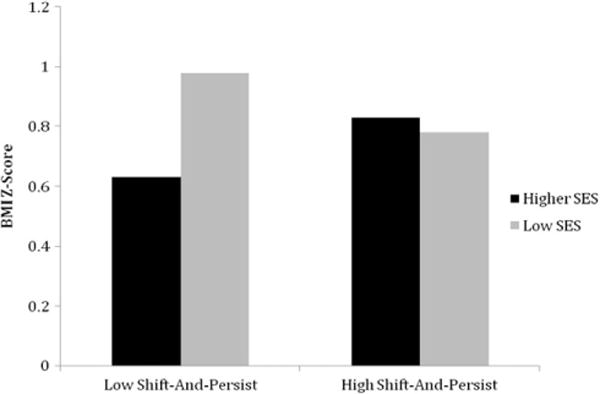
FIGURE 1.

Mean BMI z-scores by SES and level of shift-and-persist. Shift-and-persist level was split at the mean. Low SES was significantly associated with higher BMI z-score for those low in shift-and-persist, but not for those high in shift-and-persist.
