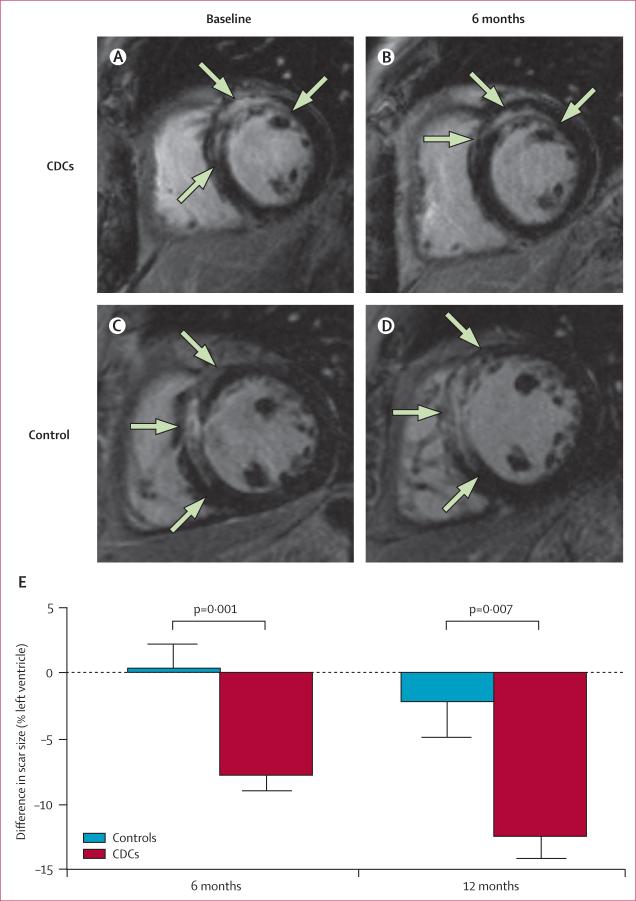
Figure 3. Representative MRI and changes in scar size.
Short-axis MRI of heart at baseline (82 days after myocardial infarction; A) and 6 months after CDC infusion (B) in a participant randomly allocated to receive CDCs. Short-axis MRI of heart at baseline (77 days after myocardial infarction; C) and after 6 months (D) in a control. Infarct scar tissue (green arrows) is evident by areas of hyperintensity (white) whereas viable myocardium appears dark. Difference in scar size from baseline to 6 months (E) or 12 months (F). CDC=cardiosphere-derived cell.

