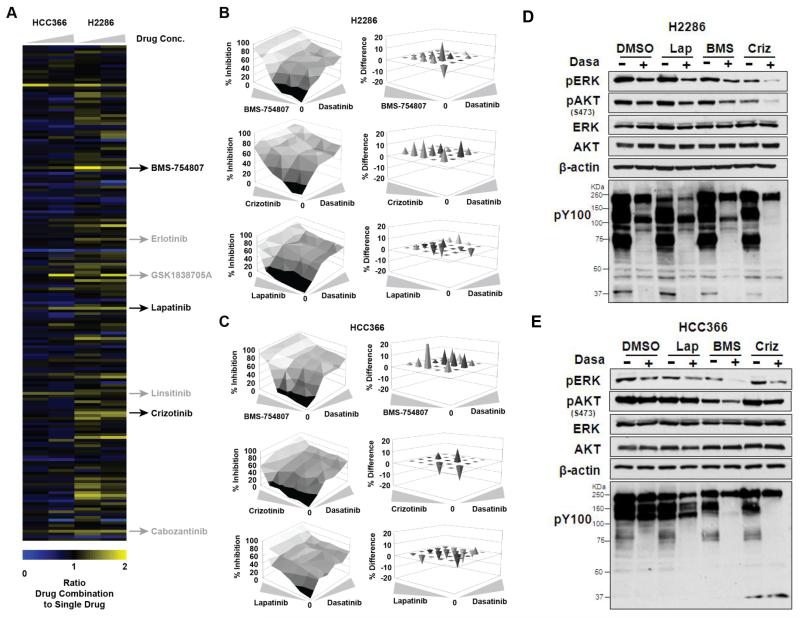
Fig. 4. Dasatinib-based drug combinations in DDR2-mutant lung SCC cells.
A: Heat map depicting ratio of inhibition of cellular viability for HCC366 and H2286 cell lines by treatment with drug combinations (with 0.1 μM dasatinib) compared to single drug (no dasatinib) using a customized library of 180 targeted compounds. These compounds were tested at 0.5 μM and 2.5 μM as indicated by the drug concentration wedge. Drug combination results were normalized to effects elicited by 0.1 μM dasatinib alone. Indicated are dasatinib combinations with the IGF-1R/IR inhibitors BMS-754807, GSK1838705A, and linsitinib, with the MET/AXL inhibitors crizotinib and cabozantinib and with the EGFR inhibitors erlotinib and lapatinib (also inhibiting ERBB2). For a summary of Bliss analysis data, based on 6-by-6 point dose-response matrices, with these drug combinations, see Supplementary Table S5. B and C: Three-dimensional dose-response matrices delimited by individual single-drug dose-response curves displaying combination effects on viability of H2286 (B) and HCC366 (C) cells at various drug concentrations. Dasatinib concentrations ranged from 8 μM to 0.031 μM in 4-fold increments. Concentrations of BMS-754807, crizotinib, and lapatinib started at 10 μM and decreased in 4-fold increments to 0.039 μM. Needle graphs display the observed average difference in cell viability from additive drug effects based on expected values that are calculated with the Bliss Model of Independence. Positive values indicate synergy, “0” denotes additivity, and negative values indicate antagonism. Only values greater than 1 standard deviation were considered significant and are depicted. D and E: Phosphorylation of ERK, AKT, and phosphotyrosine (pY100) after TKI treatment alone and in combination (0.5 μM for dasatinib, 1 μM for others, 3 hours) in H2286 (D) and HCC366 (E) cells. Lap: lapatinib (EGFR/HER2 TKI); BMS: BMS-754607 (IGF-1R TKI); Criz: crizotinib (MET/AXL TKI). Intensity of each Western blot band was quantified, and relative band intensity is shown in Fig. S1.

