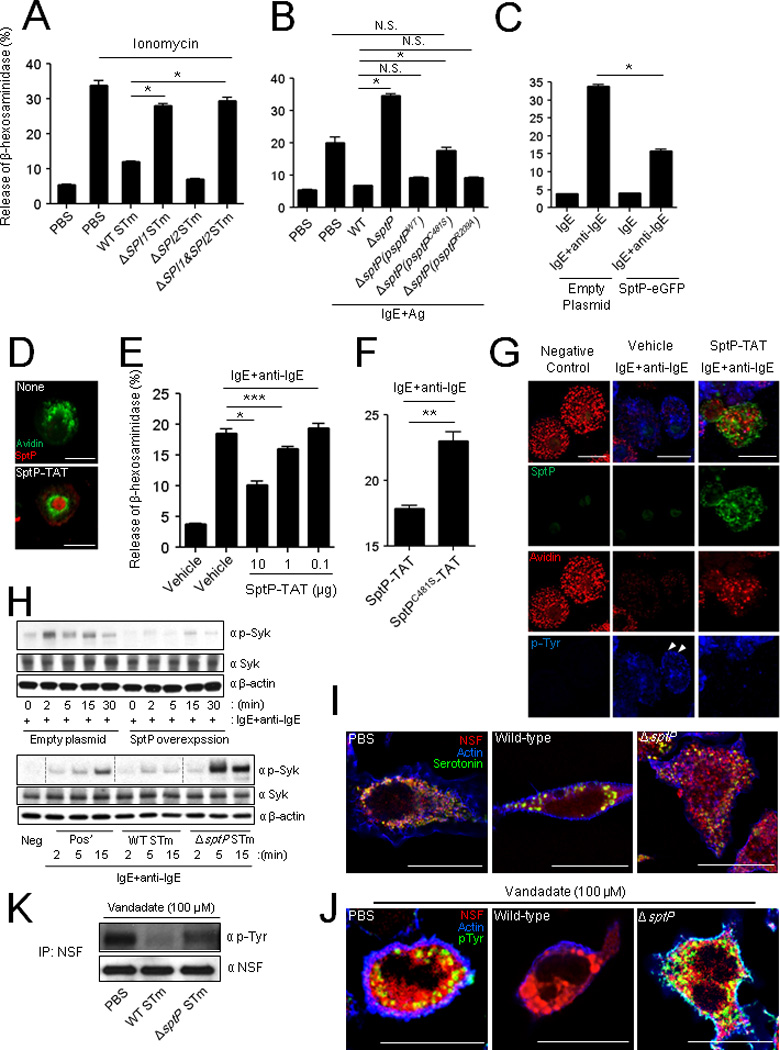
Fig 3. The protein tyrosine phosphatase domain of the SPI-1 effector, SptP, inhibits MC degranulation through dephosphorylating Syk and NSF.

(A) MC degranulation to ionomycin after 30 min pretreatment with WT, ΔSPI1 mutant, ΔSPI2 or ΔSPI1&ΔSPI2 STm strains (B) Degranulation of IgE sensitized MCs to antigen (Ag, TNP-OVA) after 45 min pretreatment with wild-type, ΔsptP or complemented ΔsptP strains (ΔsptP(psptPWT), ΔsptP(psptPC481S), or ΔsptP(psptPR209A)). (C) Degranulation of IgE sensitized MCs expressing retrovirally transduced eGFP or SptP-eGFP to anti-IgE. (D) Confocal microscopy of BMMCs exposed to SptP-TAT for 4 h. MC granules were probed with avidin (green) and intracellular SptP-TAT probed with anti-His6 (red). (E and F) Degranulation of IgE-sensitized BMMCs to anti-IgE (E) after 4 h pretreatment with increasing amounts of SptP-TAT (10, 1, and 0.1 µg) or (F) after 2 h pretreatment with SptP-TAT (5 µg) or SptPC481S-TAT (5 µg). (G) Morphological appearance of IgE sensitized BMMCs to anti-IgE after 2 h pretreatment with vehicle or SptP-TAT (10 µg). MC granules: avidin (red), SptP-TAT: anti-His6 (green), and intracellular tyrosine phosphorylation sites: anti-phosphotyrosine (p-Tyr) (blue) antibodies. (H) Western blots of cell preparations from IgE-sensitized RBLs that were either stably expressing SptP-eGFP or control eGFP (top) or were pretreated with WT STm or ΔsptP STm for 1 h (bottom) before activation with anti-IgE. The cell preparations from both experiments were obtained at indicated time points after activation with anti-IgE. Western blots were probed with α-p-Syk, α-Syk, and α-β-actin antibodies. (I, J) Morphology of RBLs after exposure to WT or ΔsptP STm. After 1 h treatment, (I) cells were stained with antibodies for fluorescence microscopy. MC granules: α-serotonin (green), NSF: α-NSF (red) antibodies and actin: phalloidin (blue). (J, K) After 1 h treatment, cells were treated with vanadate (100 µM) for 5 min to preserve tyrosine phosphorylation and (J) were stained with antibodies for fluorescence microscopy. NSF: α-NSF (red) and intracellular tyrosine phosphorylation: α-pTyr (green) and actin: phalloidin (blue). (K) Lysates from RBLs were analyzed by immunoprecipitation and immunoblotting for phosphotyrosine and NSF. Scale bar is 20 µm. Mean ± SEM, *p<0.001, **p<0.01, ***p<0.05. See also Figure S1 and S2.
