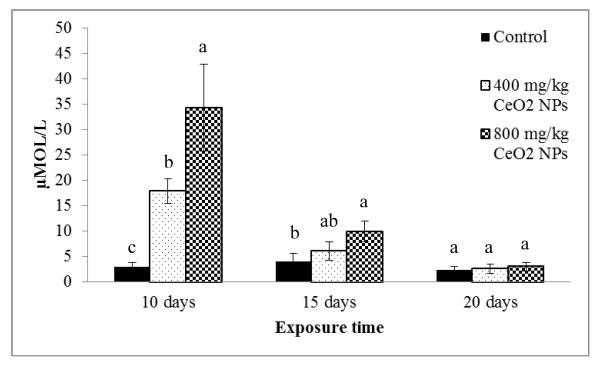
Figure 1.
H2O2 production in shoots of corn plants germinated and grown in soil treated with CeO2 NPs at 0, 400, and 800 mg/kg. All data show the means of a total of three replicates (nine plants/replicate). Error bars represent standard deviation. Means with same letters, within each exposure time, are not significantly different (Tukey’s HSD multiple comparison at p ≤ 0.05).

