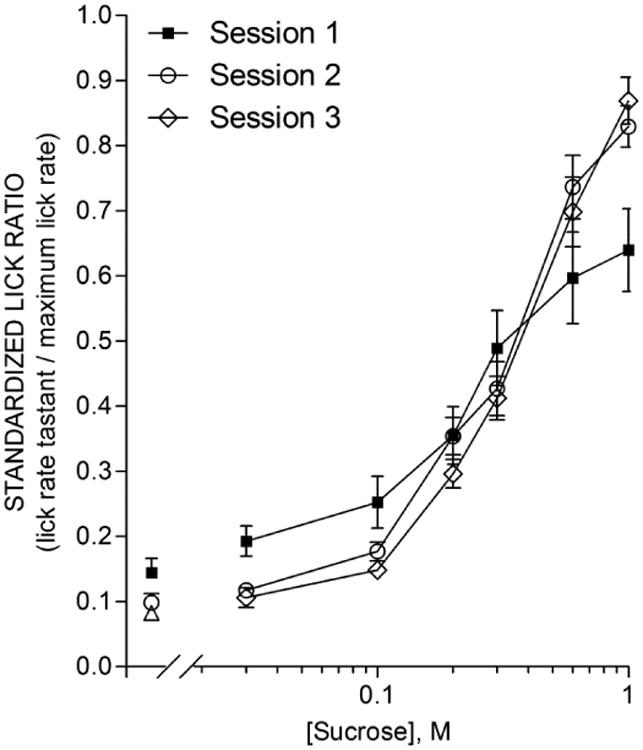
Figure 4. Mice naive to sucrose modify their taste responses after the first exposure.

Mean (± s.e.m.) licks to sucrose of 12 mice in each of 3 consecutive sessions separated by 48 h. Sucrose concentrations (0, 0.03, 0.1, 0.2, 0.3, 0.6, and 1.0 M) were presented in random 5-s trials. Lick rates are presented as the standardized lick ratio (see Methods). The Session 1 lick-concentration function was flatter than that for Session 2 and 3, as supported by a significant Session × Concentration interaction (F(12,132) = 5.39, p <0.0001) which also appeared when comparing just Session 1 and 2 or just Session 1 and 3 but disappeared when comparing just Session 2 and 3.
