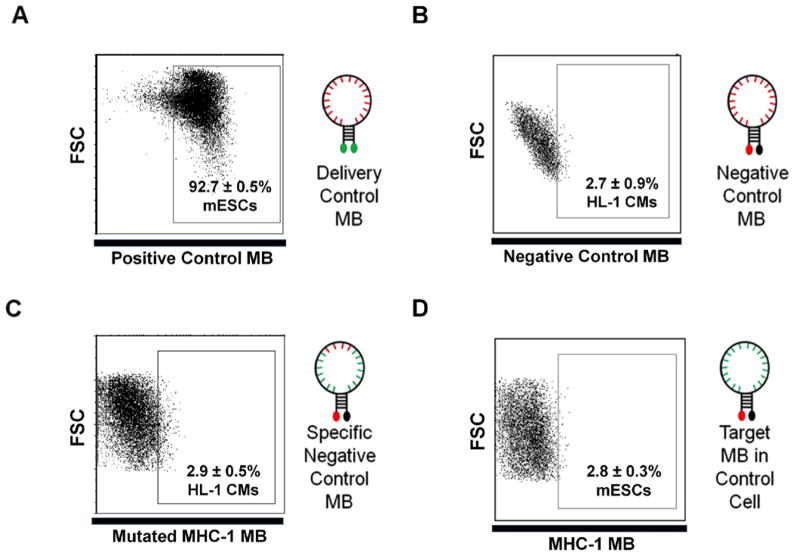
Figure 3. Example of control experiments required to demonstrate beacon specificity.
(a)Representative data using a delivery control MB in mouse ESCs (a schematic depicting a delivery control beacon is shown on the right). The random sequence (red nucleotides) delivery beacon with two dyes is used to demonstrate high delivery efficiency and uniformity. All dot plots depict a representative flow cytometry assay where 20,000 events were collected using log scales for both fluorescence and FSC measurements. Each condition was repeated three times to generate the SD shown. (b) Representative flow cytometry data using a negative control MB in mouse HL-1 cells (A schematic depicting a negative control beacon is shown on the right). Random negative control beacons are delivered into target cells to demonstrate that beacon signals do not arise from MB degradation or non-specific intracellular interactions. (c) Representative flow cytometry data using a mutant beacon as a negative control delivered into HL-1 cells to confirm MB signal specificity. A schematic depicting the specific negative control MB with four mutated base pairs in red is shown on the right. (d) Representative flow cytometry data generated using a MB targeting the Myh6 mRNA delivered into negative control mouse ESCs to demonstrate MB specificity. When the MBs are delivered into control cells a low fluorescence signal is generated, demonstrating MB specificity in a cellular environment. A schematic depicting a MB designed to hybridize to a specific target sequence (green nucleotides) is shown.

