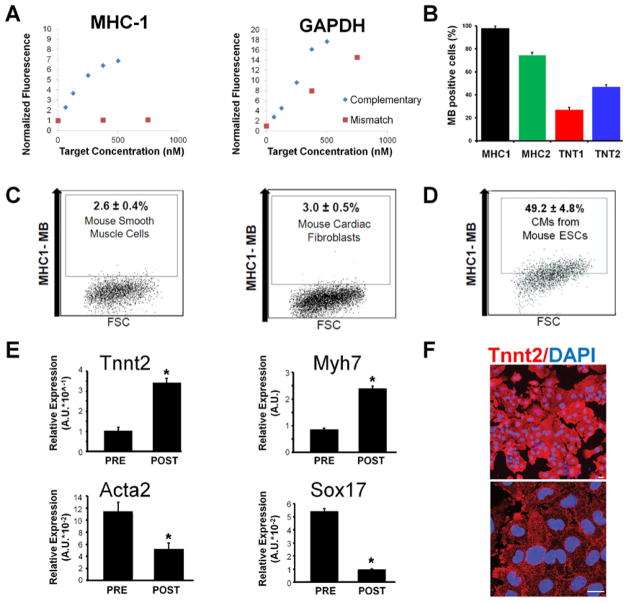
Figure 4. Anticipated results of MB validation, optimization and target cell type characterization.
(a) Examples of MB validation by fluorescence measurement in solution where MHC1 beacon displays a normal response to target and mismatch oligonucleotides, and the GAPDH beacon shows a lack of specificity due to high signal level in the presence of mismatched oligonucleotide target. Roughly 10% of MB designs fail to adequately discriminate between target and mismatched oligonucleotides. (b) Delivery of MBs into positive control cells (e.g., HL-1 CM) resulted in different signal levels. For CM isolation, two MBs targeting the MYH6/7 mRNA displayed high fluorescence signal whereas two MBs targeting the TNNT2 mRNA showed relatively low signal. MB design MHC1 gave the highest signal level, therefore should be selected for subsequent use. Roughly 50–80% of MBs fail to adequately discriminate between positive and negative control cells. Data in this histogram represent percentage of MB positive cells based on flow cytometry, error bars represent one SD. (c) The MHC-1 MB was subsequently tested in non-cardiac cell types including cultured smooth muscle cells and cardiac fibroblasts that may be present in a differentiating culture of PSCs. A very low percentage of these cells had high fluorescence intensity, which is expected based on the results shown in Figure 3. All dot plots depict a representative flow cytometry assay where 20,000 events were collected using log scales for both fluorescence and FSC measurements. Each condition was repeated three times to generate the SD shown. (d) The MHC-1 MB was tested in cells derived from mouse ESCs. A high percentage of these cells showed a significantly increased beacon signal, which correlated well with the proportion of TNNT2 positive cells. However, PSC-derived cells may express high, medium, or low levels of the target gene, and the results from FACS assays are likely to be less clear-cut than those seen in the control cells. (e) Results of qRT-PCR of the mixed cell population (PRE) from differentiating mouse ESCs and MB positive cells (POST) after MB based sorting displaying increased expression of CM-specific genes (Tnnt2 and Myh7) and decreased expression of gene markers (Acta2 and Sox17) from alternative lineages. Roughly 75% of MBs validated in previous steps are useful for sorting stem cell derived CMs. Data in these histogram represent comparative RT-PCR with all genes normalized to GAPDH via the ddCT method described in Step 5, error bars represent one SD, t-Tests were carried out to determine significance. (f) Immunocytochemistry results showing >98% of the MB-sorted cells from differentiating mouse ESCs are positive for cardiac marker Actn2. The lower image is an enlargement of the upper image. Scale bars, 20 μm.

