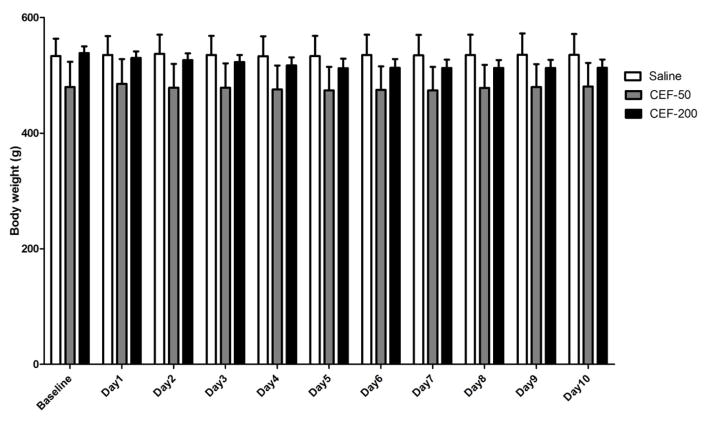
Figure 3.
Graph represents average body weight (g) of P rats during the 10 days of re-exposure to ethanol. Based on GLM repeated measures followed by one-way ANOVA, ceftriaxone treatment (50 and 200 mg/kg/day) did not cause a significant change in body weights as compared to saline vehicle-treated control group. Data are expressed as mean ± SEM). Saline group (n=5); ceftriaxone groups (50 and 100 mg/kg, i.p. body weight, n=6 for each group)

