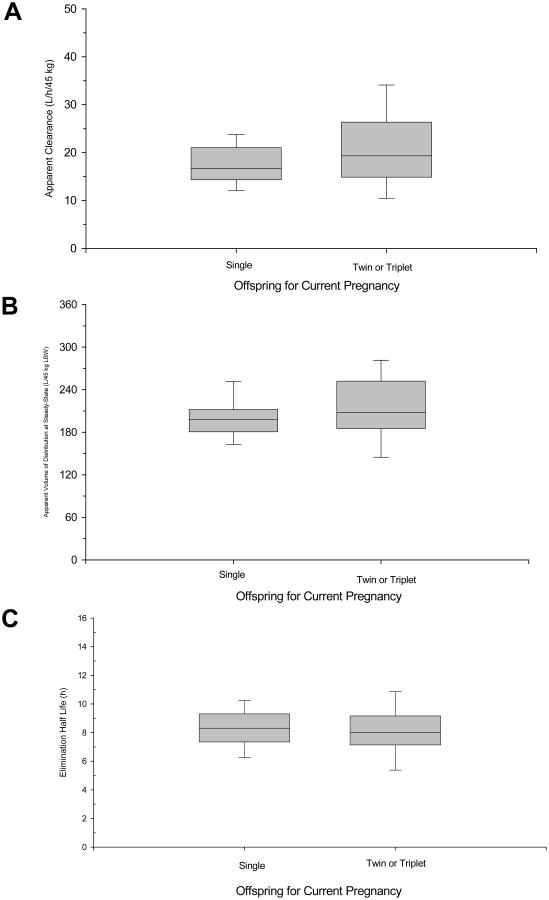
Figure 2.
Effect of single and multiple gestation on Bayesian estimates of betamethasone pharmacokinetic parameters for individual patients. (A) Box plots of apparent betamethasone clearance for singleton and multiples pregnancies. (B) Box plots of apparent volume of distribution at steady-state for singleton and multiples pregnancies. (C) Box plots of betamethasone elimination half lies for singleton and multiples pregnancies. The limits of the box represent the 25th to 75th percentile of the distribution, the solid line in the box is the median value and the whiskers represent the 10th and 90th percentiles of the distribution.

