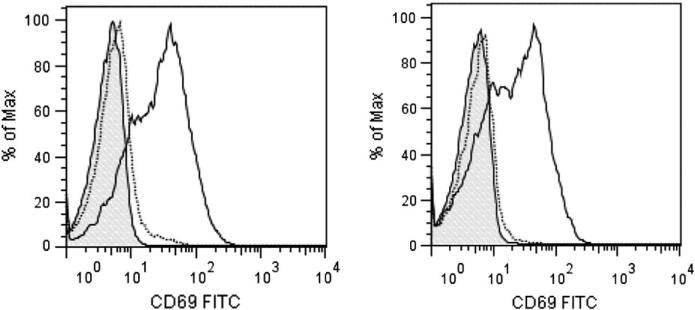
Fig. 1.
NK cell activation. NK cells isolated from the peripheral blood of healthy donors were stimulated for 16 h with IL-2. Activation status of the NK cells was determined by monitoring increase in the CD69 levels on the surface of the NK cells using flow cytometry. Data shown is for NK cells isolated from two different healthy donors. Control NK cells (dotted line) and IL-2 stimulated cells (solid line) were labeled with FITC-conjugated anti-CD69 antibody. Shaded area depicts binding of non-specific murine IgG antibody.

