
Figure 6.
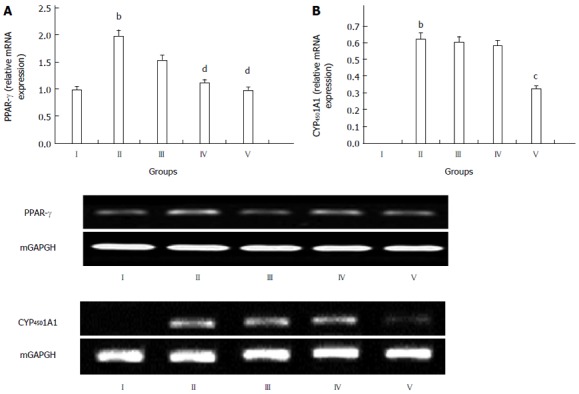
Effects of gypenosides on the gene expression in the liver tissue of high fat and sugar feed treated rats. A: Rabbit anti-proliferator activated receptory (PPARγ); B: Rabbit anti-cytochrome P4501A1 (CYP1A1). (I) normal control, (II) model, (III) gypenosides (GPs) (200 mg/kg) + HFSD, (IV) GPs (400 mg/kg) + HFSD, (V) GPs (800 mg/kg) + HFSD. The values are expressed as mean ± SD in each group. bP < 0.01 vs normal control; cP < 0.05, dP < 0.01 vs model, n = 12.