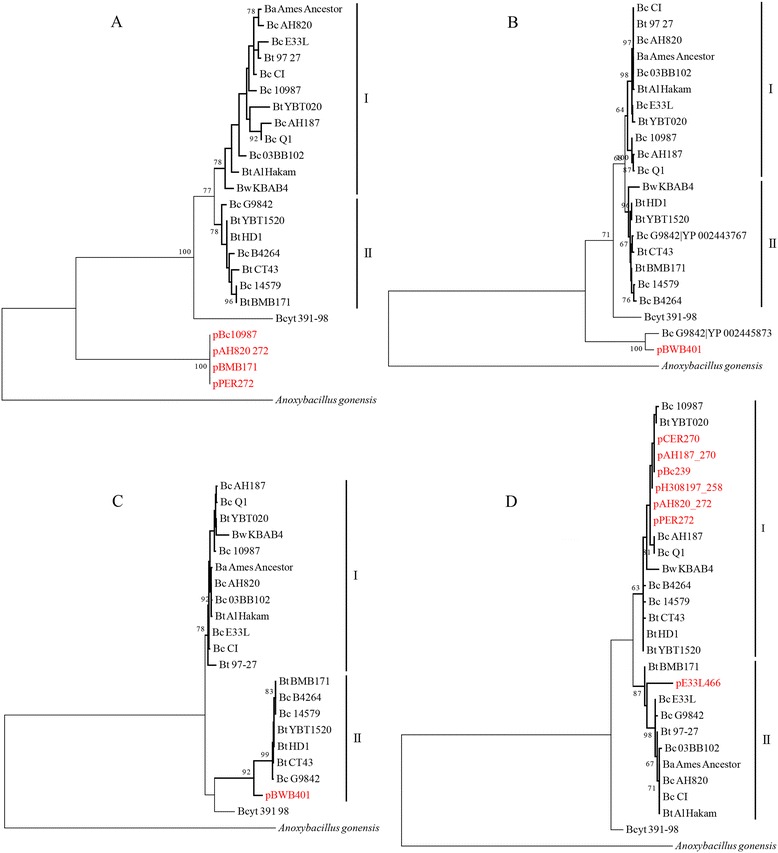
Figure 4.

Phylogenetic analysis based on the protein sequences of the shared genes between plasmids and the chromosomal core gene set. (A) Shared genes on plasmids appeared as an outgroup from their homologous chromosomal core genes. (B) Shared genes on plasmids and one copy of the chromosome appeared as outgroups from their homologous chromosomal core genes. (C) Shared genes on plasmids were clustered with one of the lineages based on their homologous chromosomal core genes. (D) Shared genes on plasmids were distributed in both lineages based on their homologous chromosomal core genes. Homologous protein sequences from Anoxybacillus gonensis were used as an outgroup for the homologies from the entire B. cereus group. Lineages I and II were defined as in our previous work [30]. The number at each branch point represents the percentage of bootstrap support calculated from 100 replicates, and only those values higher than 60 are shown.
