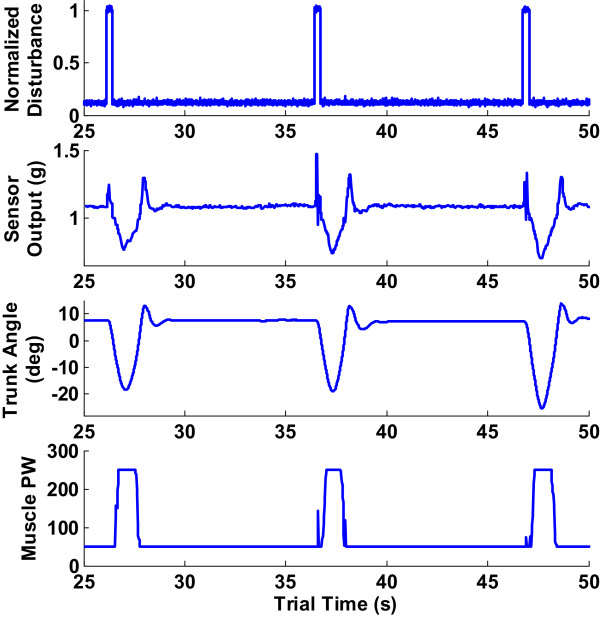
Figure 3.

Typical complete trial consisting of 3 cycles of perturbation force application from a trial with Subject S1. Top plot is the normalized disturbance, second plot is the accelerometer sensor output (in g’s) which was used as a measure of trunk forward flexion, third plot is the trunk angle computed from marker data and last plot is the muscle pulse-width for the erector spinae muscle activated as a consequence of change in trunk tilt.
