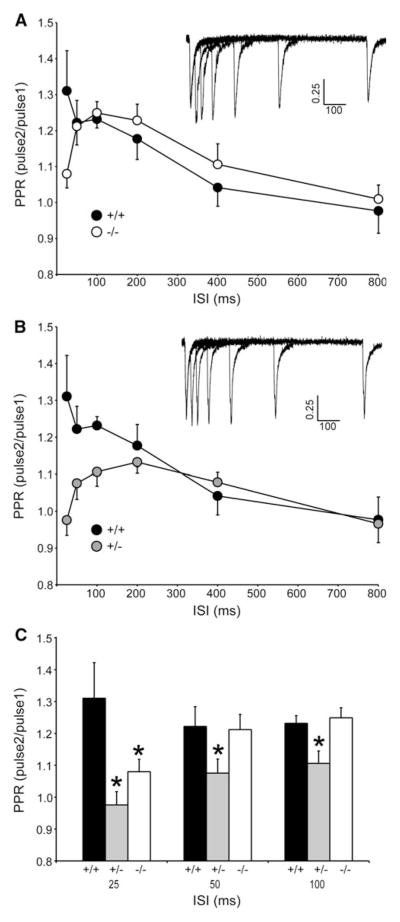
Fig. 2.
Paired pulse alterations. a Paired pulse ratio (PPR) measurements of parkin−/− mice compared to parkin+/+ controls is shown with a plot of the ratio of the initial slope of the second pulse divided by the initial slope of the first pulse as a function of inter-stimulus intervals. PPR values >1 indicate paired-pulse facilitation. Example traces from a parkin−/− recording are shown. b The PPRs of parkin+/− mice compared to the parkin+/+ controls are plotted. Example traces from a parkin+/− recording are shown. c PPR of the three shortest ISIs are compared between all three genotypes. Parkin−/− mice have significantly reduced PPR compared to wild-type controls at the 25 ms ISI (P < 0.05), while parkin+/− have significantly reduced PPR at 25, 50, and 100 ms ISI (P < 0.05). No significant differences were seen in either genotype at the longer ISIs (parkin+/+ n = 10 slices from 7 animals, parkin+/− n = 17 slices from 11 animals, and parkin−/− n = 14 slices from 10 animals)

