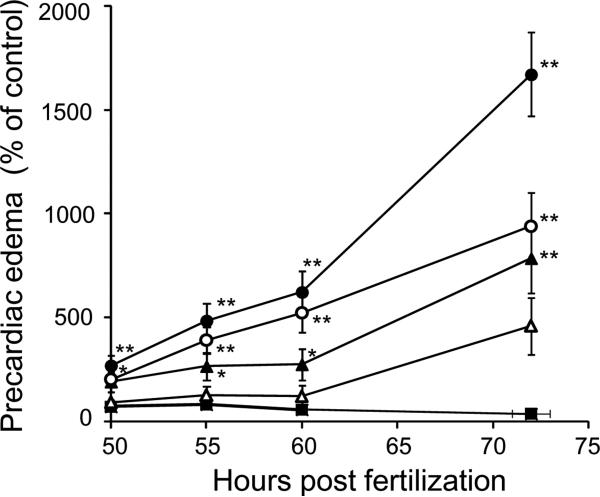
FIG. 2.
Time course of precardiac edema formation induced by TCDD. Precardiac area was indicated as percentage of control in developing zebrafish exposed to graded concentration of TCDD (0.3 ppb, open triangles; 0.5 ppb, filled triangles; 1 ppb, open circles; 2 ppb, filled circles) and vehicle (0.1% DMSO, filled square), at various time points (50-72 hpf). Results are expressed as mean ± SEM (N = 15-23). Asterisk indicates statistical significance compared to control at each stage (*p < 0.05, ** p < 0.01).

