
Figure 5. Vessel density.
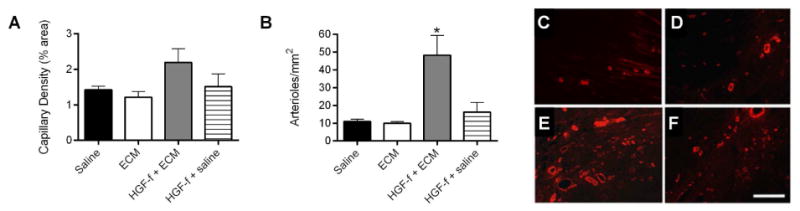
Quantification of neovasculature in the infarct region indicates a trend towards an increase in capillary density (A) and a significant increase in arteriole density (B) with HGF-f delivered from ECM hydrogels (*p < 0.05). Data is mean ± SEM. Administration of HGF-f alone had a small effect in arteriole formation, though it was not significantly greater than the ECM hydrogel alone or the saline control. Representative images of vascularized areas of infarcts from animals injected with saline (C), ECM (D), HGF-f in ECM (E), and HGF-f in saline (F) illustrate the differences in arteriole density, here stained for α-smooth muscle actin (red). Scale bar is 200μm.